
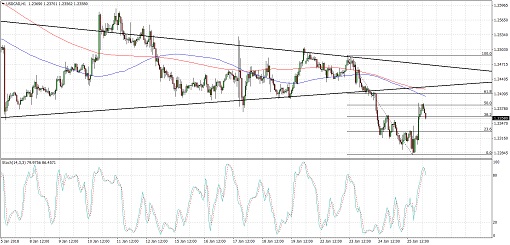
USDCAD recently broke to the downside of its symmetrical triangle formation and fell to a low of 1.2240. Price has bounced since then and appears to be making a correction to the broken support around 1.2420.
Applying the Fib retracement tool on the breakout move shows that the 61.8% level is closest to the broken support but the pair seems to be finding resistance at the 50% level already. Stochastic is also on the move down to reflect a return in selling pressure.
The 100 SMA is below the longer-term 200 SMA so the path of least resistance is to the downside. These moving averages are also close to the area of interest, adding to its strength as potential resistance. If it holds, the pair could fall back to the swing low or lower.
The US dollar drew some support in the New York session as US President Trump said that he sees the currency getting stronger and stronger. He also said that Treasury Secretary Mnuchin’s remarks on a weaker dollar being good for trade as taken out of context.
Data from the US turned out mixed as the initial jobless claims rose from 216K to 233K but was better than the estimated 239K figure. New home sales sank from a downgraded 689K figure to 652K versus the estimated drop to 627K. Advance GDP data is due next and a 3.0% growth figure is eyed.
As for the Canadian dollar, the currency could find some support from oil prices and more positive updates from NAFTA. Retail sales turned out mixed as the headline figure disappointed but the core reading showed a 1.6% gain versus the estimated 0.8% uptick. Canada’s CPI readings are lined up next.
By Kate Curtis from Trader’s Way