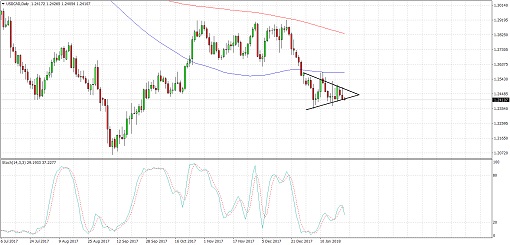
USDCAD has been treading mostly sideways in the past few days and is consolidating inside a bearish flag formation visible on the daily time frame. Price is currently testing the triangle support and a breakdown could send it to the lows around 1.2100.
On the other hand, an upside break could take it up to the resistance at 1.2900. The 100 SMA is below the longer-term 200 SMA to signal that the path of least resistance is to the downside, which suggests that a move lower is more likely to happen than a break higher. In addition, the 100 SMA could add an extra upside barrier around 1.2600.
Stochastic is pulling up from oversold levels, though, so bulls are taking over while bears are taking a break. In that case, USDCAD might still bounce back up to the top of the small triangle formation before picking a clear direction.
The Loonie was able to draw some support from more upbeat discussions on NAFTA as some key members of the negotiating teams acknowledged that progress is being made. Trump still looks willing to walk out if Canada or Mexico don’t give in to U.S. demands in the auto industry but other sectors could see more developments.
In contrast, the dollar was the weakest currency for yet another day as risk-taking and weak data dragged it down. Safe-haven flows also moved to the Japanese yen and Swiss franc instead.
Up ahead, the crude oil inventories data could lead to more volatility for the oil-related Loonie and a buildup might be reported after the API capped off its streak of reductions. Analysts are still expecting a draw of 1 million barrels in the EIA report but there could be room for a downside surprise.
By Kate Curtis from Trader’s Way