
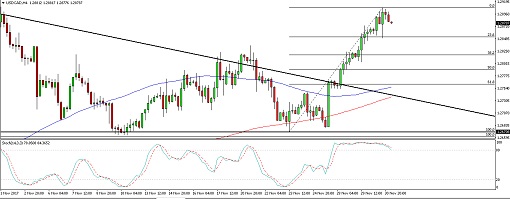
USDCAD recently broke out of a long-term descending triangle pattern to signal that an uptrend is underway. Price hit resistance around the 1.2900 mark and is starting a correction to the broken triangle resistance.
Applying the Fib tool on the latest swing low and high on the 4-hour time frame shows that the 61.8% retracement level lines up with the broken resistance around the 1.2750 minor psychological level. This is also close to the moving averages’ dynamic inflection points.
The 100 SMA is above the longer-term 200 SMA to confirm that the path of least resistance is to the upside. However, stochastic has been indicating overbought conditions for some time, which means that buyers are exhausted and might allow sellers to take over for a while.
Economic data from the US has been mostly stronger than expected, with personal spending and income both surpassing expectations and initial jobless claims printing a lower increase in unemployment. Traders are paying close attention to tax reform progress in Senate, which is due to have a full vote on their version of the bill this week.
Support from Senator John McCain has buoyed the dollar higher on stronger hopes of seeing the bill approved, but the next challenge is merging with the version of the House before moving to the White House for Trump’s signature. Rumors that Secretary of State Tillerson is about to be replaced on account of differences with Trump in dealing with North Korea has still kept geopolitical risks in play.
As for the Canadian dollar, traders seem to have shrugged off the OPEC deal extension as this scenario has been widely expected. Crude oil dipped on the likelihood of seeing a review in June, which means that the deal could still be called off if the market overheats then.
By Kate Curtis from Trader’s Way