
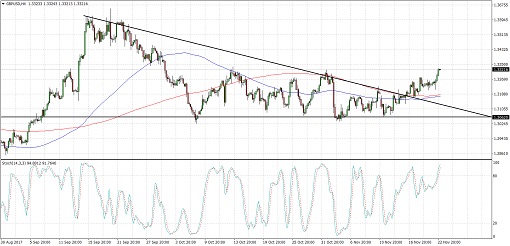
GBPUSD appears to have finally broke out of its consolidation pattern on the 4-hour chart. Price surged past the resistance of its descending triangle, indicating its intention to go for more gains.
The chart pattern is approximately 900 pips tall so the resulting breakout could be of the same height. However, the 100 SMA is still below the longer-term 200 SMA so the path of least resistance is to the downside. Stochastic is also indicating overbought conditions, which means that buyers are starting to feel exhausted.
Still, the gap between the moving averages has narrowed to show a potential upside crossover that might draw more buyers in. A quick pullback to the broken triangle resistance at 1.3150-1.3200 could take place before the pair heads any further north.
The pound took hits due to downgraded growth forecasts released during the Autumn Forecast Statement and increased its borrowing estimates for the next few years to offset the impact of Brexit. However, the currency stabilized as Hammond reassured that support will be provided to help the economy weather any uncertainties.
Meanwhile, the dollar was weaker across the board during the release of the FOMC minutes as it confirmed that policymakers were increasingly concerned about weak inflation. Many participants worried that inflation would run below target for much longer than expected, hinting at a less aggressive pace of tightening for 2018.
US banks are closed for the Thanksgiving holidays so lower liquidity and higher volatility for major pairs are eyed. The UK is scheduled to release its second estimate GDP for Q3 but no revisions to the earlier 0.4% estimate are expected.
By Kate Curtis from Trader’s Way