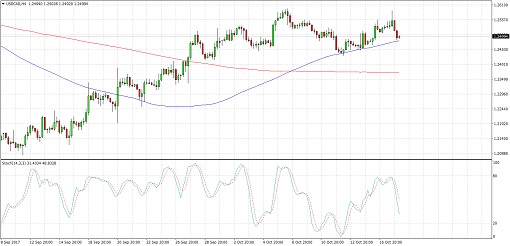
USDCAD previously broke below its ascending channel formation then pulled up for a retest, creating a head and shoulders pattern visible on the 4-hour time frame. Price has yet to complete the right shoulder and test the neckline around the 1.2450 minor psychological level.
A break below this support could lead to a drop of around 150 pips or the same height as the chart pattern. Stochastic is turning lower to signal the presence of bearish momentum, but the 100 SMA is above the longer-term 200 SMA so the path of least resistance might still be to the upside.
Price is also moving close to testing the 100 SMA dynamic support that might keep losses in check. If so, USDCAD could bounce back up to the 1.2600 area and beyond.
The US dollar has gained some support from strong medium-tier reports and rumors that Trump is leaning towards appointing a more hawkish Fed head than previously expected. December rate hike expectations remain in play but market watchers seem to be turning their attention to the odds of more tightening moves next year.
As for the Canadian dollar, the slow progress in NAFTA renegotiations has actually been positive since this might delay scrapping any trade agreements. Mexico and Canada have rejected the latest batch of proposals from the Trump administration and another round of talks is scheduled for next month.
Up ahead, US building permits and housing starts figures are due, but the bigger movers might be speeches from FOMC members Dudley and Kaplan. Canada has its manufacturing sales figure due and analysts are expecting to see a smaller 0.1% dip this time.
By Kate Curtis from Trader’s Way