
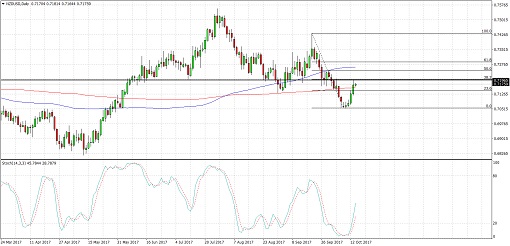
NZDUSD previously broke below a head and shoulders reversal pattern neckline, indicating that a downtrend is in the cards. The chart pattern is approximately 350 pips tall so the resulting selloff could be of the same size.
However, price is still making a correction to this broken neckline to gather more bearish pressure. Applying the Fib tool on the latest swing high and low shows that this lines up with the 38.2% retracement level and the .7200 major psychological resistance.
The 100 SMA is still above the longer-term 200 SMA, though, so there may be some bullish pressure left. If so, price could still break past the area of interest and resume its uptrend. At the same time, stochastic is pulling up from the oversold region to signal that buyers are regaining the upper hand.
US data came in mostly weaker than expected on Friday, with downbeat CPI readings taking the spotlight and weighing on Fed rate hike expectations for December. Headline inflation came in at 0.5% versus 0.6% while the core reading stood at 0.1% versus 0.2%. Retail sales data turned out mixed, with the headline reading up 1.6% versus 1.7% and the core figure at 1.0% versus 0.9%.
Over the weekend, Yellen gave a testimony which contained upbeat remarks on heir assessment and outlook for the economy. There’s not much in the way of top-tier reports from the US today since only the federal budget balance is lined up.
As for the Kiwi, New Zealand’s CPI is due next and a 0.4% uptick in price levels is eyed for Q3 after the report printed a flat reading for Q2. Stronger than expected data could keep the currency bid while downbeat results could allow the selloff to resume.
By Kate Curtis from Trader’s Way