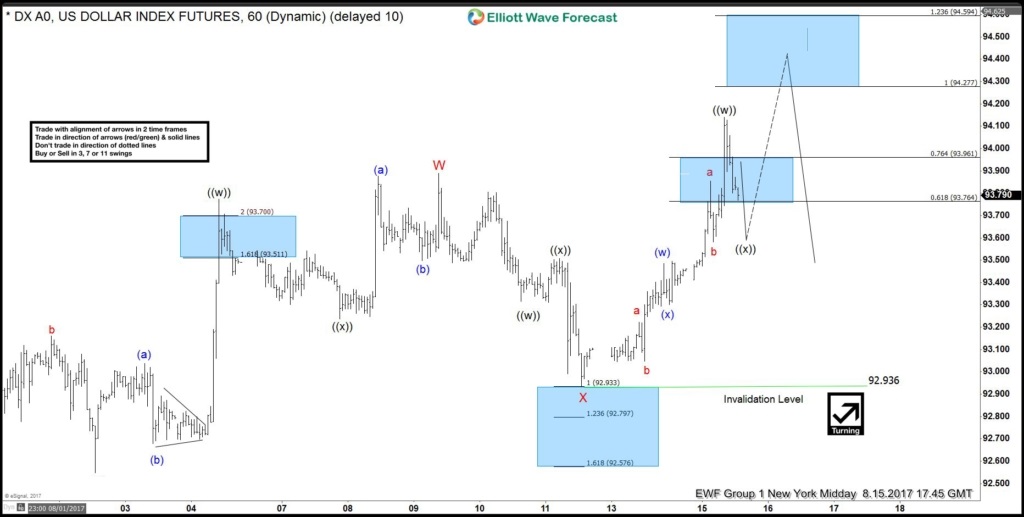
Short term USDX index Elliott Wave view suggests that the decline to 8/02 (92.54) low ended intermediate wave (3) then the rally from there is unfolding as a a double three Elliott wave structure. As the structure from the 8/02 looks to be overlapping, hence suggesting it’s corrective structure, either W,X,Y or W,X,Y,Z.
Where the first leg higher ended in Minor wave W at 93.77 & pullback to 92.93 low ended Minor wave X. Minor wave Y currently in progress as double three structure , where Minute wave ((w)) ended at today’s peak 94.04. And while near term dips remains above 92.93 low index has scope to extend 1 more push higher towards 94.27-94.59 100%-123.6% fibonacci extension area to end the cycle from 8/02 lows in intermediate wave (4) bounce then index has scope to resume the decline or should do a 3 waves pullback at least ( if it continues to extend higher later on as W,X,Y,Z). However we don’t like buying the index and expect seller’s to appear again in between 94.27-94.59 area for more downside or for 3 waves pullback at least.
USDX 1 Hour Elliott Wave Chart
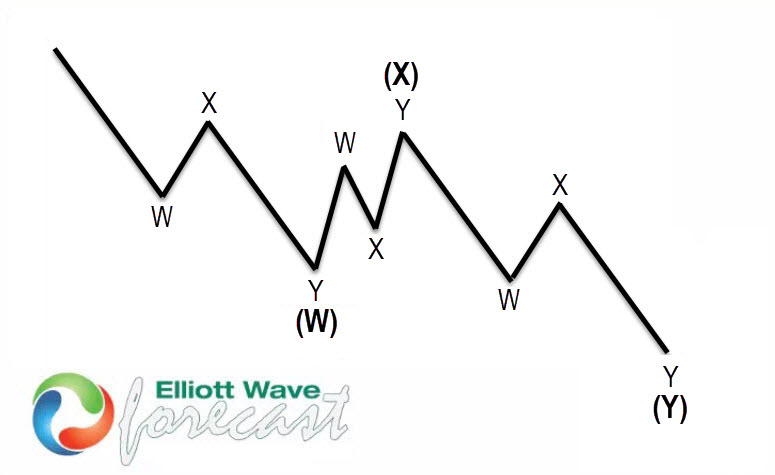
Anyone of you, who is not familiar with W,X,Y ( Double three structure ) here’s some explanation:
Double three is the most important pattern in the new Elliott wave theory and probably the most common pattern on the market these days, also known as 7 swing structure. It is a very reliable pattern that is giving us good entries with clearly defined invalidation levels and target areas. The image below shows what Elliott Wave Double Three looks like. It has (W), (X), (Y) tagging and internal structure 3,3,3, which means that all 3 legs are corrective sequences. Each (W) and (Y) are made of 3 swings, have structure W, X, and Y to a lesser extent.
Source : https://elliottwave-forecast.com/forex/usdx-elliott-wave-view-double-three


