
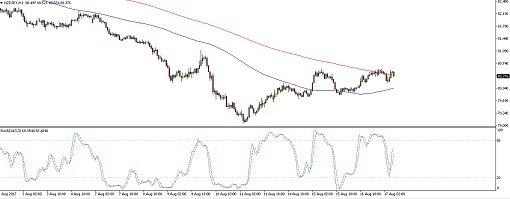
NZDJPY appears to be done with its tumble as price is forming an inverse head and shoulders pattern on its 1-hour time frame. Price also seems to have broken past the neckline at 80.00 to confirm that gains are in the cards.
The chart pattern is approximately 100 pips tall so the resulting rally could be of the same size. However, the 100 SMA is still below the longer-term 200 SMA to indicate that the path of least resistance is to the downside. In other words, the selloff is more likely to resume than to reverse.
Price is still testing the 200 SMA dynamic resistance but a break higher could be enough to confirm that buyers are regaining the upper hand. Stochastic is also pointing up to signal that bullish momentum is returning.
New Zealand reported stronger than expected quarterly PPI, which sets the tone for stronger inflationary pressures down the line. Over the weekend, the Q2 retail sales figures also indicated a strong pickup in consumer spending, which would likely support overall growth.
As for the yen, the pickup in risk appetite after concerns about North Korea eased is forcing the lower-yielding currency to retreat. However, Japan just reported stronger than expected trade balance, supporting the idea of JGB trimming by the BOJ.
There are no other reports due from either Japan or New Zealand for the rest of the week so this pair could move to the tune of overall market sentiment, which might be driven by headlines in the next few days.
By Kate Curtis from Trader’s Way