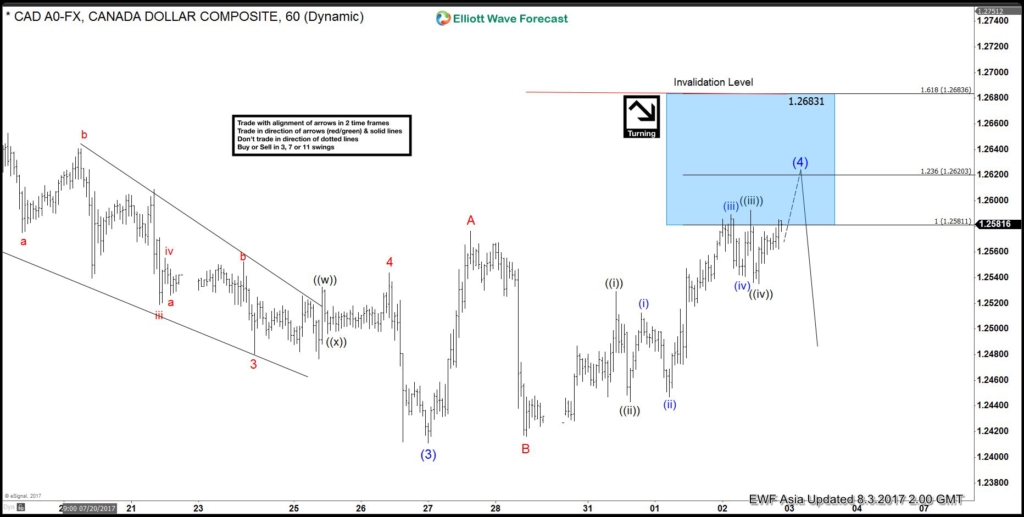
Short term USDCAD Elliott Wave view suggests the decline to 1.2411 ended Intermediate wave (3) of an Elliott Wave impulse structure from 6/2 peak. Intermediate wave (4) bounce is in progress as a flat Elliott wave structure where Minor wave A ended at 1.2576 and Minor wave B ended at 1.2416. Minor wave C is subdivided as an impulse Elliott Wave structure. Up from 1.2416 low, Minute wave ((i)) ended at 1.253, Minute wave ((ii)) ended at 1.2443, Minute wave ((iii)) ended at 1.2593 and Minute wave ((iv)) ended at 1.2355. Near term focus is on 1.262 – 1.2683 to complete Intermediate wave (4) flat. Afterwards, pair should either resume to new low or at least pullback in 3 waves. We don’t like buying the proposed bounce.
USDCAD 1 Hour Elliott Wave Chart
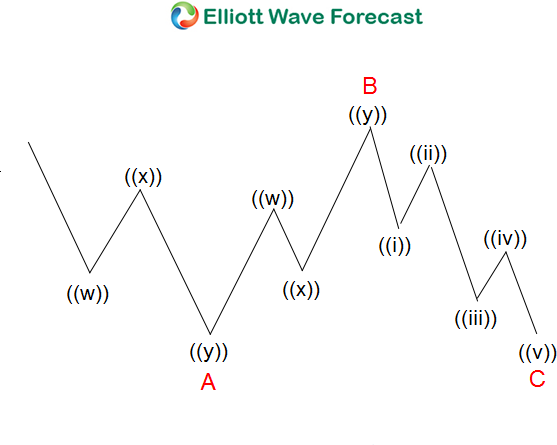
Elliott Wave FLAT structure is a 3 waves corrective pattern and there are 3 different types of Flats:
– Regular flat.
– Expanded flat
– Running flat.
The flat seen in USDCAD above is the Regular flat type. A Regular flat is a 3 waves corrective pattern which could often be seen in the market nowadays. The internal subdivision of Flat is labeled as A,B,C with 3-3-5 structure. Waves A and B are subdivided in corrective structures such as zigzag, flat, double three or triple three. Third wave C is always 5 waves structure, either as a motive impulse or an ending diagonal pattern. It’s important to notice that in a Regular Flat, wave B completes slightly above the starting point of wave A. Wave B usually ends at 50%, 61.8%, 76.4%, or 85.4% of wave A and Wave C of regular flat usually ends close to 100% -1.236% Fibonacci extension of A related to B.
Source : https://elliottwave-forecast.com/forex/usdcad-elliott-wave-flat-correction


