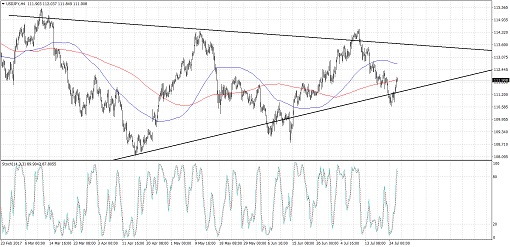
USDJPY has formed lower highs and higher lows on its 4-hour time frame, trading inside a symmetrical triangle pattern. Price is currently testing support and could be due for a bounce back to resistance.
The 100 SMA is above the longer-term 200 SMA so the path of least resistance is to the upside. In addition, stochastic is pointing up to indicate that bullish momentum is in play. However, the gap between the moving averages is narrowing to signal a potential downward crossover while the oscillator is nearing overbought levels.
If bearish pressure kicks in, USDJPY could test the triangle support at 111.50 again or attempt to break lower. The chart pattern is approximately 500 pips tall so the resulting breakout could be of the same size.
The main event risk for this pair is the FOMC decision as traders are waiting to find out if the Fed would maintain its hawkish bias or not. Recall that CPI and retail sales have been weaker than expected but there’s a good chance that policymakers might insist that these are due to temporary factors.
Reiterating that they are prepared to hike rates one more time before the year ends and signaling that they could start balance sheet unwinding in September could spur stronger dollar demand. On the other hand, a shift in tone to a more cautious one could trigger losses.
As for Japan, data on household spending and inflation due on Friday could also lead to big yen moves since this could determine whether the BOJ would stick to its dovish stance or not.
By Kate Curtis from Trader’s Way