
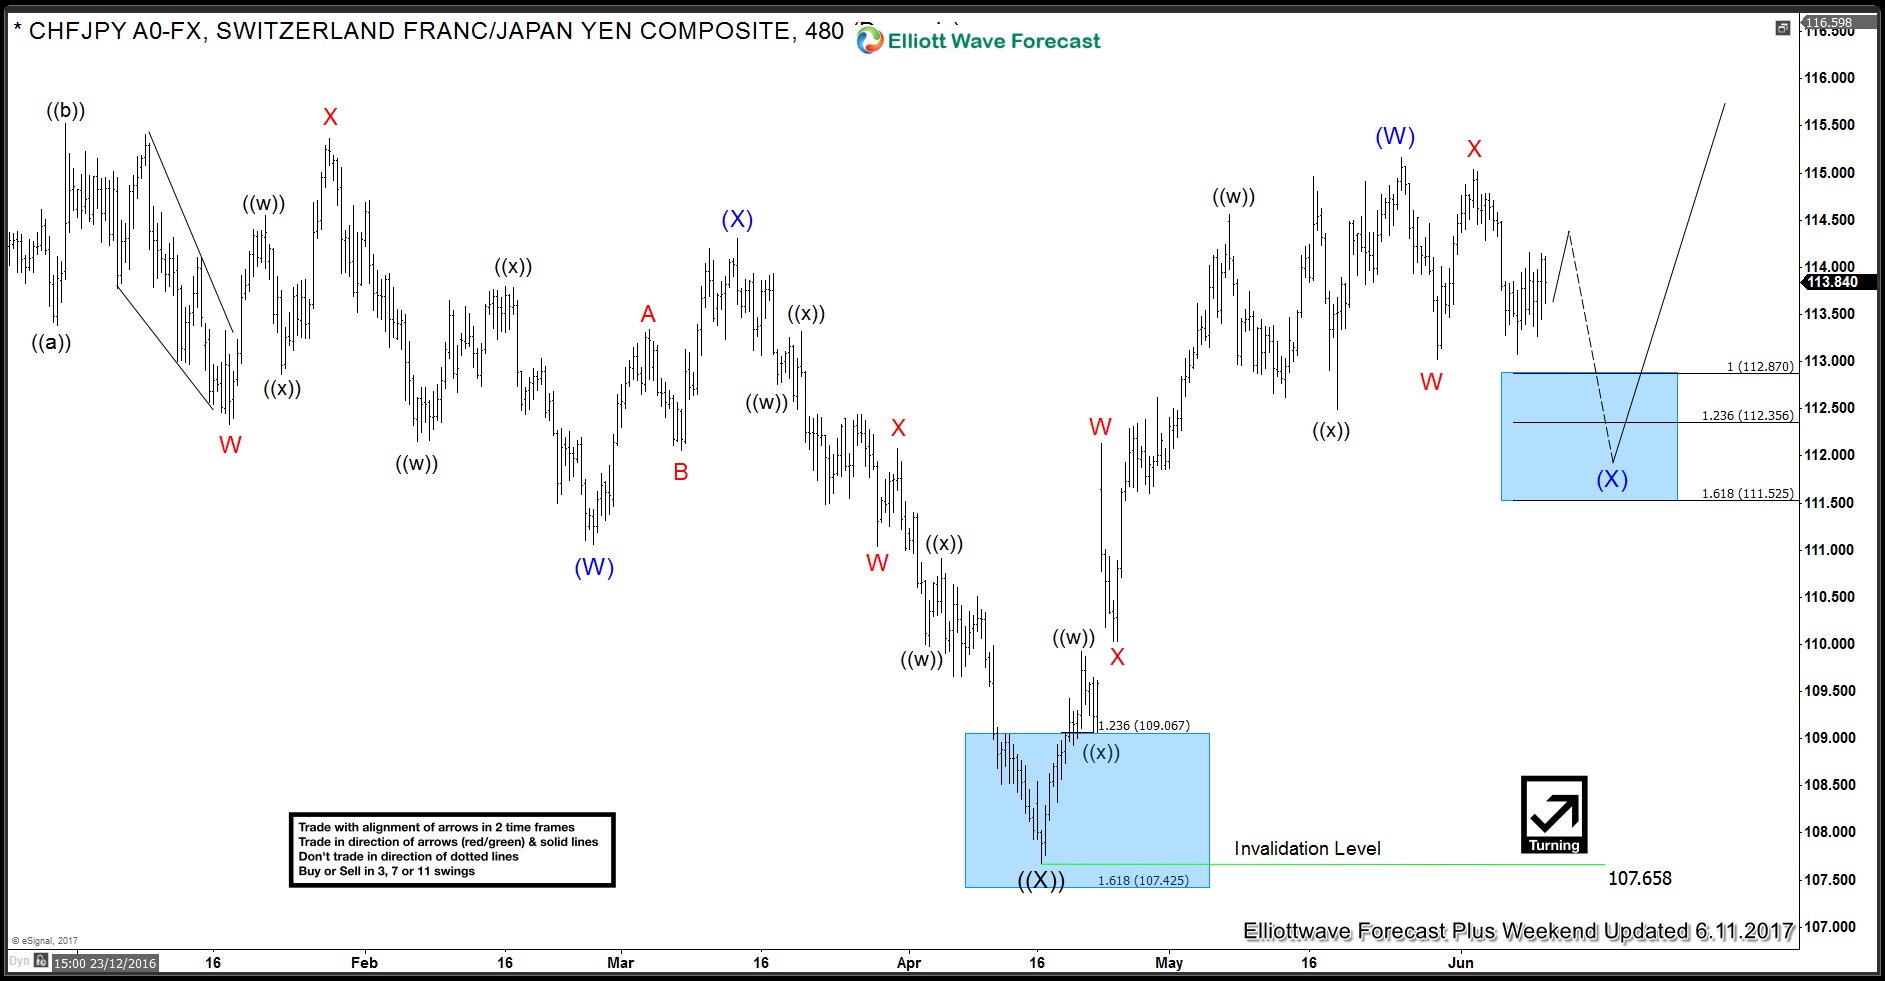
In this article we will take a look at Elliott Wave structure of CHF JPY pair since the low at 4.16.2017. Move up from 4.16.2017 (107.67) to 5.25.2017 (115.16) was in 7 swings and completed wave (W). Then we saw the pair pull back from the highs. Below is the 480 minute chart presented to clients on 11th June 2017 where we were looking for pair to end the correction in 112.87 – 111.52 area and resume the rally for new highs.
CHF JPY 11 June 480 minute chart
CHF JPY 30 June 480 minute chart
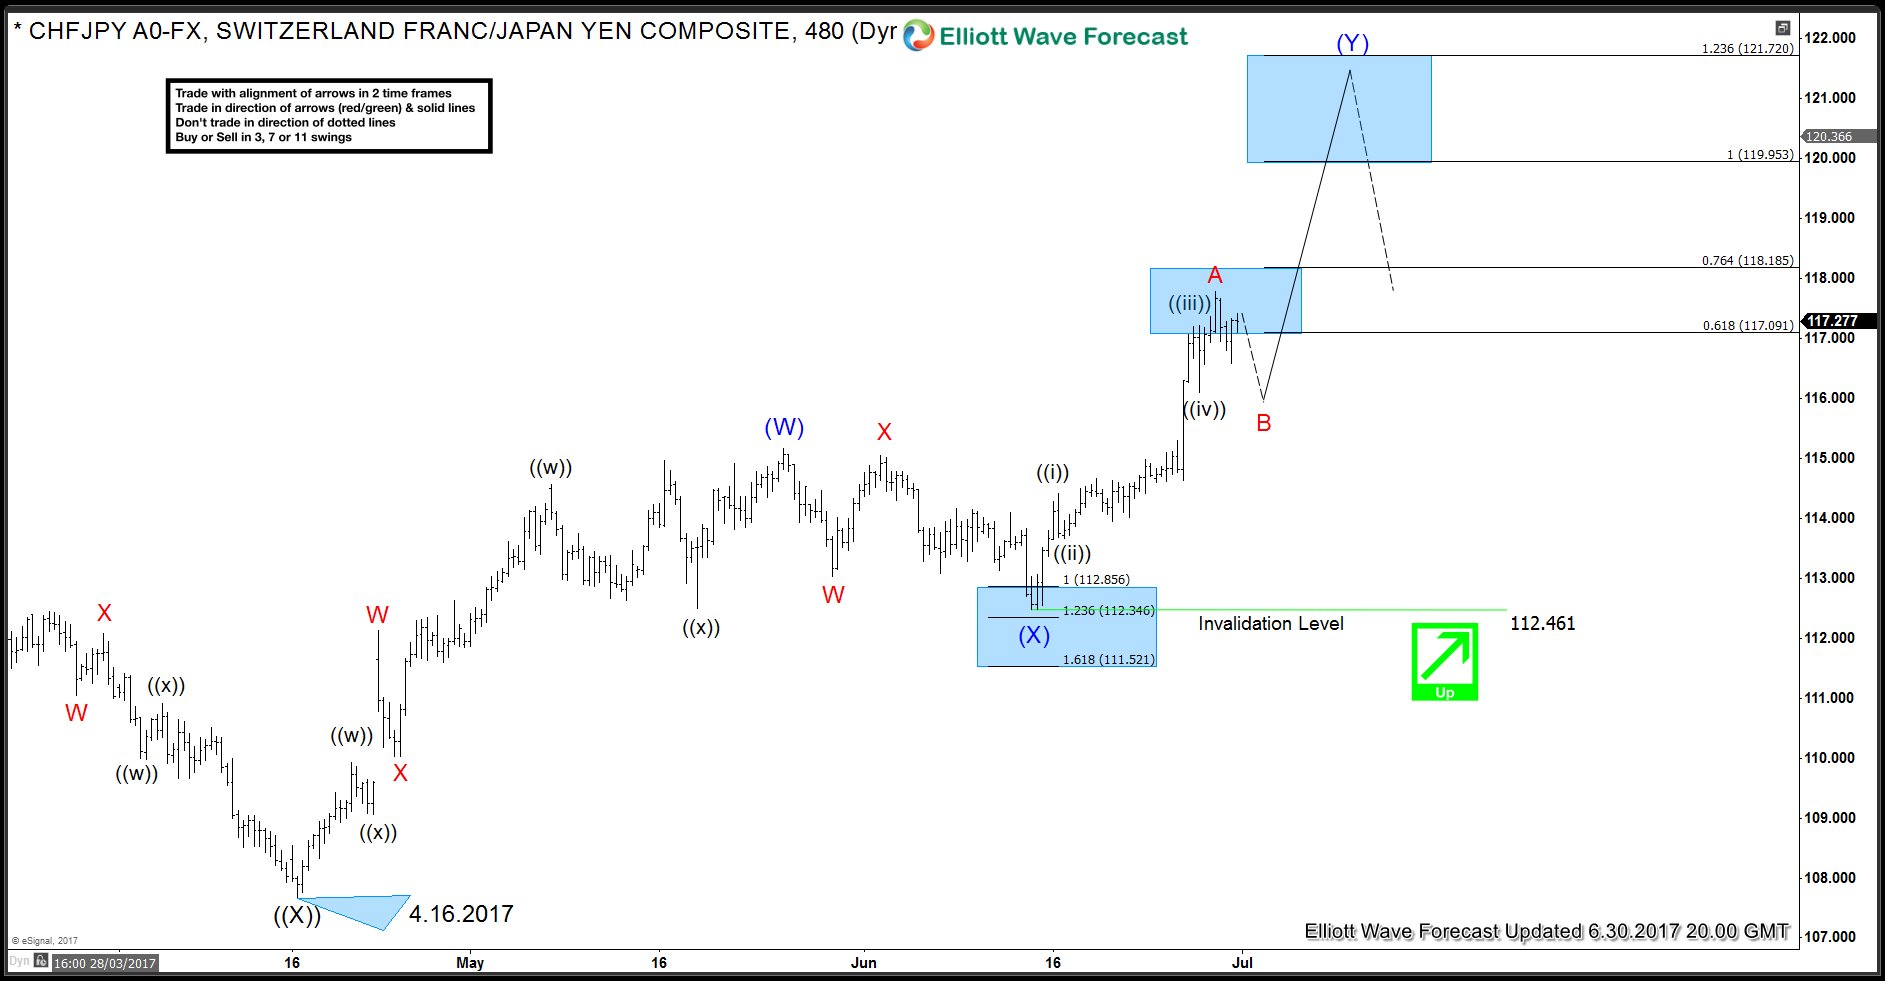
Pair found buyers in the blue box between 112.87 – 111.52 and rallied to new highs as expected. With the latest rally from 112.46 – 117.78, pair is showing 5 swings up from 4.16.2017 low which is a bullish sequence and calls for more upside against 112.46 low to complete a double three Elliott wave structure. Pair has reached 0.618 – 0.764 Fibonacci extension area of (W)-(X) between 117.00 – 118.18 which is the typical area for 5th swing to end in a 7 swing sequence. Thus, we are expecting the pair to make a pull back in wave B and continue higher towards 119.95 – 121.72 area. We don’t like selling the pair in proposed wave B pull back and expect dips to find buyers in 3, 7 or 11 swings for continuation higher. If pair drops from here 116.23 – 115.94 would become next area of interest for wave B to complete and buyers to appear to start C leg higher or bounce in 3 waves at least.
Source : https://elliottwave-forecast.com/forex/chf-jpy-bullish-elliott-wave-sequence