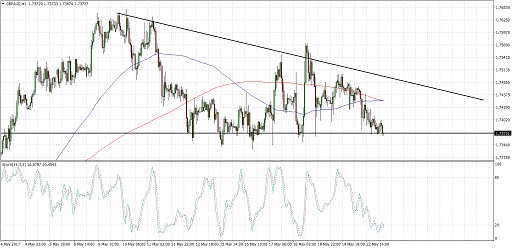
GBPAUD has formed lower highs and found support at the 1.7375 area, creating a descending triangle formation on its 1-hour time frame. This chart pattern is around 250 pips tall so a breakout in either direction could result in a rally or selloff of the same height.
Price is currently testing support and could be due for a downside break as the 100 SMA is below the longer-term 200 SMA. However, the gap between the moving averages has narrowed to indicate a potential upside crossover that might draw more buyers to the mix. In addition, stochastic is pulling up from the oversold zone to reflect a return in bullish momentum.
The British pound is currently being weighed down by reports of an explosion in Manchester Arena in the UK, leading to 19 fatalities and at least 50 injured. To top it off, political risk is back in the spotlight as the UK could walk out of Brexit talks if the EU slaps them with a bill. Negotiations and the snap election are set to happen next month.
Meanwhile, concerns about the Chinese and Australian economies are starting to fade as the focus appears to be shifting back to geopolitical risks. There have also been no major reports out of Australia and China so far this week. Either way, changes in market sentiment could also be a driving factor for this pair moving forward.
By Kate Curtis from Trader’s Way