
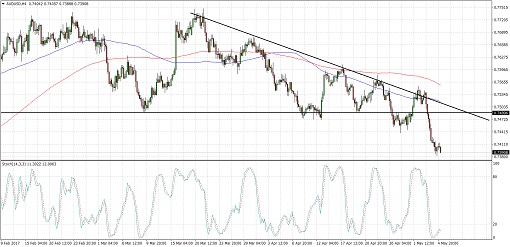
AUDUSD formed lower highs and found support at the .7500 major psychological level, creating a descending triangle chart pattern. Price just broke below the triangle support, signaling that a downtrend is due.
The chart pattern is approximately 250 pips tall so the resulting selloff could last by the same amount. The 100 SMA is below the 200 SMA and lines up with the triangle resistance, indicating that the path of least resistance is to the downside.
Stochastic is already indicating oversold conditions so buyers might take over from here. If so, a pullback to the broken triangle support could be underway before more bears join in on the action.
Economic data from Australia has been weaker than expected as the trade surplus narrowed from 3.66 billion AUD to 3.11 billion AUD, lower than the estimated 3.33 billion AUD figure. To top it off, official and Caixin PMI readings from China from both the manufacturing and non-manufacturing sectors printed weaker than expected results and indicated a slowdown in expansion, likely dampening demand for Australia’s commodity exports down the line.
Meanwhile, the dollar has gained support after the FOMC retained their upbeat economic outlook, keeping rate hike expectations in play. Also, the healthcare bill passed the House of Representatives, reflecting a small victory for the Trump administration and their fiscal policy agenda. US NFP data is due today and leading indicators have been suggesting an upside surprise so there could be room for more dollar rallies.
By Kate Curtis from Trader’s Way