
Gold to Silver Ratio Daily Elliott Wave Chart
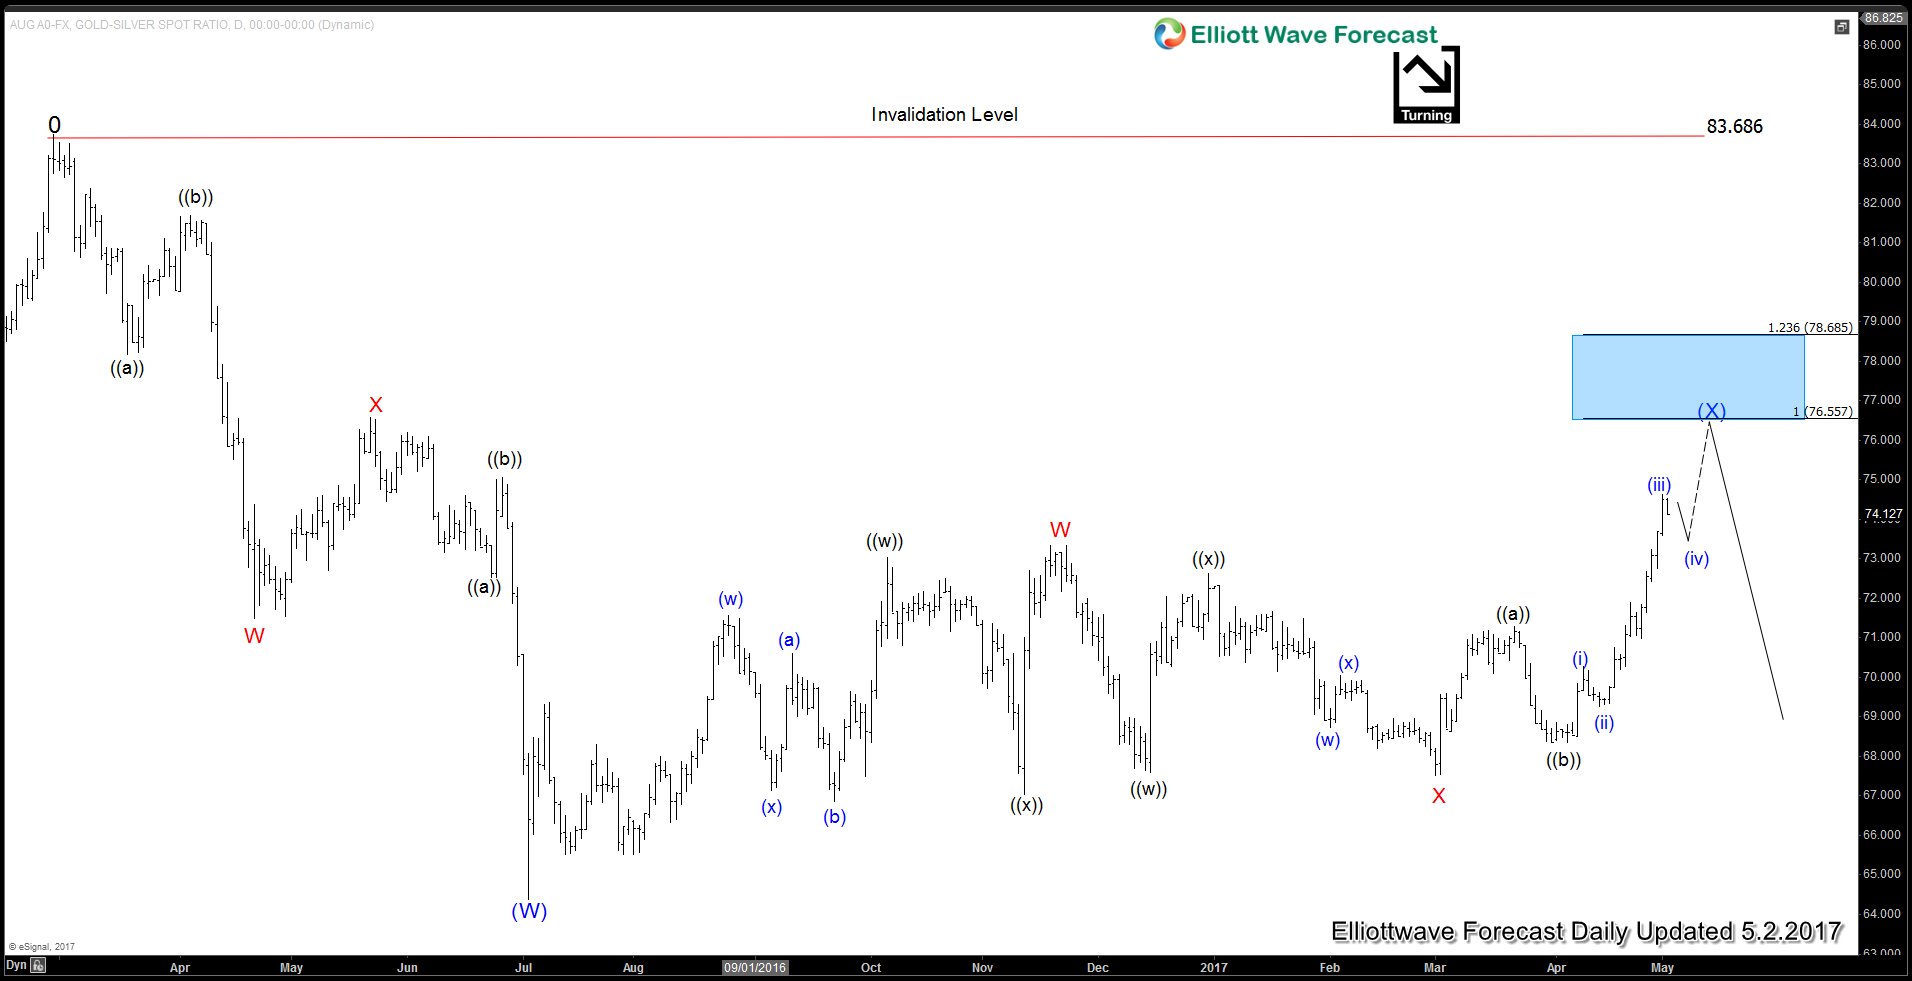
Daily chart of Gold-to-Silver ratio above suggests that the ratio is correcting cycle from 2/29/2016 peak (83.68) before the decline resumes later, provided that pivot at 83.68 high stays intact. Short term, cycle from 7/4/2016 low (64.37) is showing a 5 swing incomplete sequence, favoring further upside in the short term. Expect the ratio to extend higher towards 76.55 – 78.68 area to end the rally from 7/4/2016 low, then it should at least pullback in 3 waves if not continue the next leg lower.
As the Ratio is inversely correlated with the underlying physical metals, this suggests that a higher ratio implies a lower XAUUSD and XAGUSD. Thus, we could expect short term weakness in both metals to persist until the Ratio reaches the target of 76.55 – 78.68, then when the Ratio turns lower, both metals can get support and start rallying also.
Source : https://elliottwave-forecast.com/video-blog/gold-short-term-weakness-likely