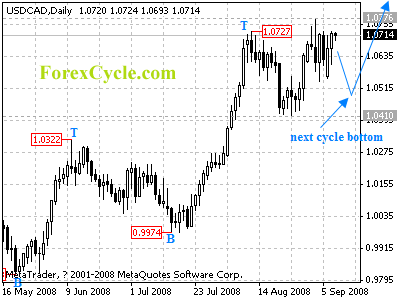
USDCAD traded in a narrow range between 1.0541 and 1.0776 for several days. Pullback towards 1.0500 zone to reach the next cycle bottom on daily chart would more likely be seen before breaking above 1.0776 previous high. However, a break of 1.0776 level will signal resumption of up trend, and then further rally could be seen to 1.1400 zone.
For long term analysis, USDCAD is in bullish movement. Further rise towards 1.1400 to reach the next cycle top on monthly chart is now in favor.


