
Hello traders! USDCAD has completed a 3-wave recovery against the 1.41403 peak and reacted lower as expected. In this technical article, we’ll take a brief look at the Elliott Wave outlook for USDCAD and outline the key target levels
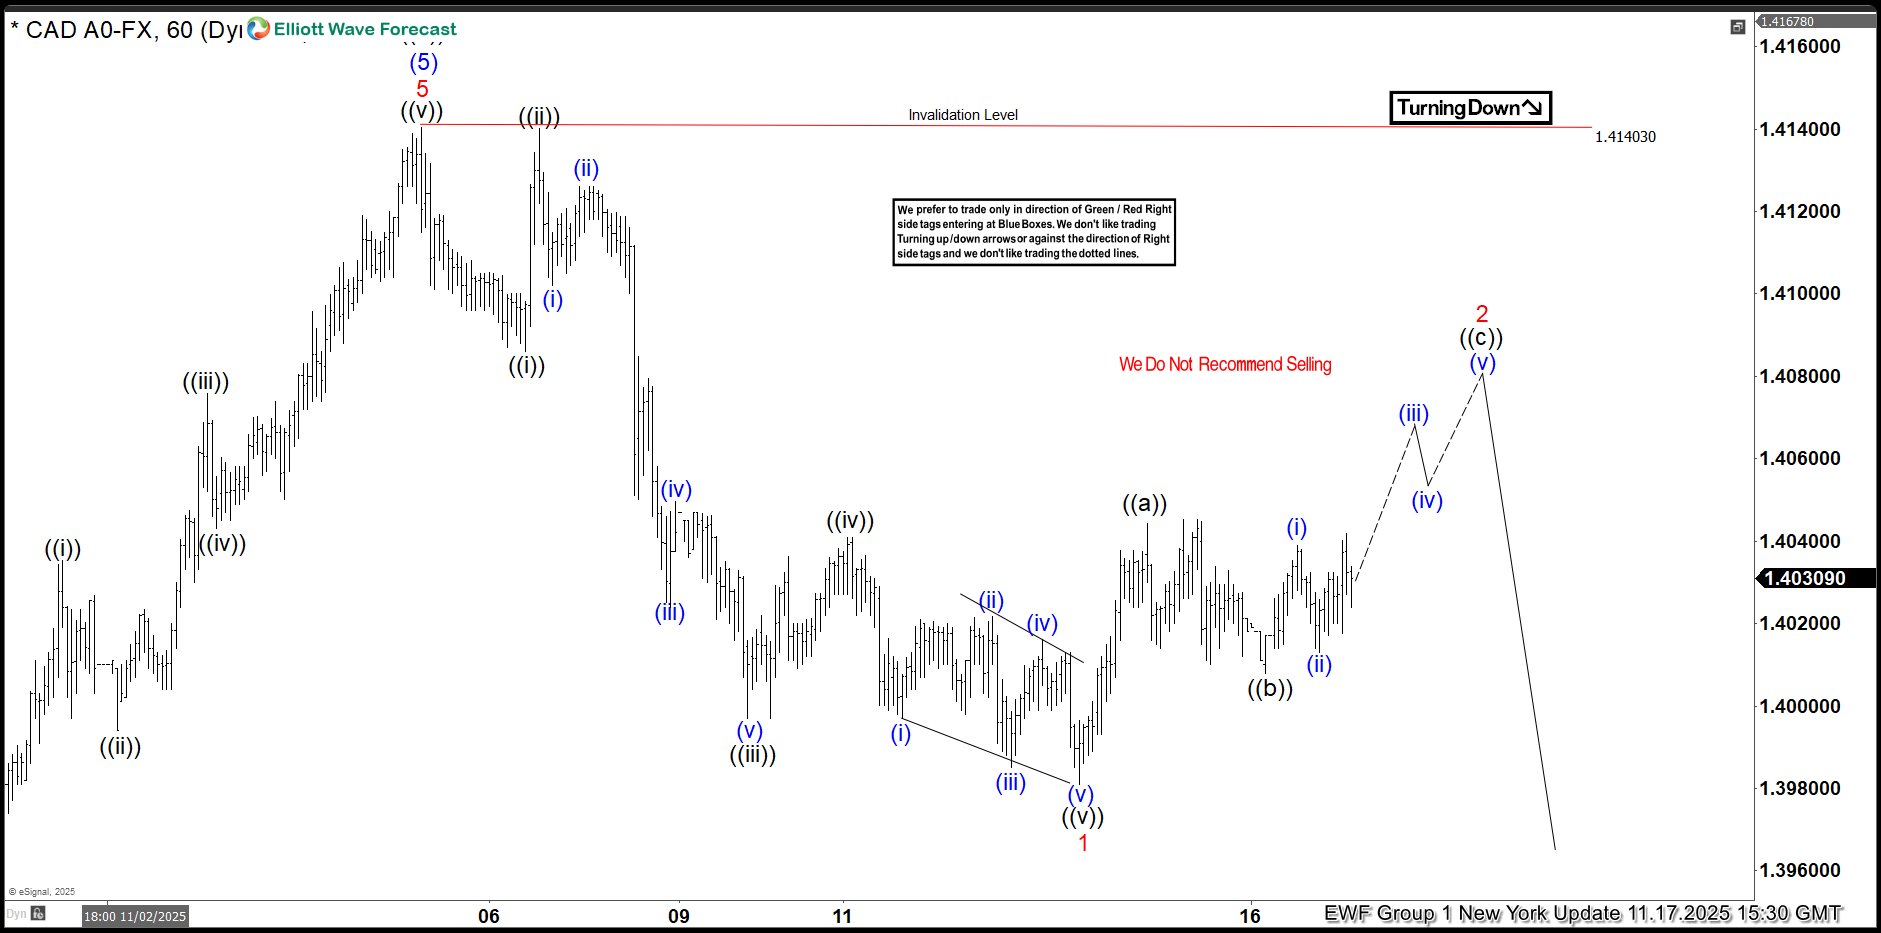
USDCAD Elliott Wave 1 Hour Chart 11.17.2025
Let’s take a look at the USDCAD Elliott Wave chart from November 17th, which we presented to members. The pair completed 5 waves in the cycle from the 1.41403 peak, which suggests further downside once a 3-wave correction is finished. The approximate target area for wave 2 typically falls within the 50%–61.8% Fibonacci retracement, which in this case comes in at 1.4062–1.4080. From that zone, we expect further weakness.
90% of traders fail because they don’t understand market patterns. Are you in the top 10%? Test yourself with this advanced Elliott Wave Test
Official trading strategy on How to trade 3, 7, or 11 swing and equal leg is explained in details in Educational Video, available for members viewing inside the membership area.
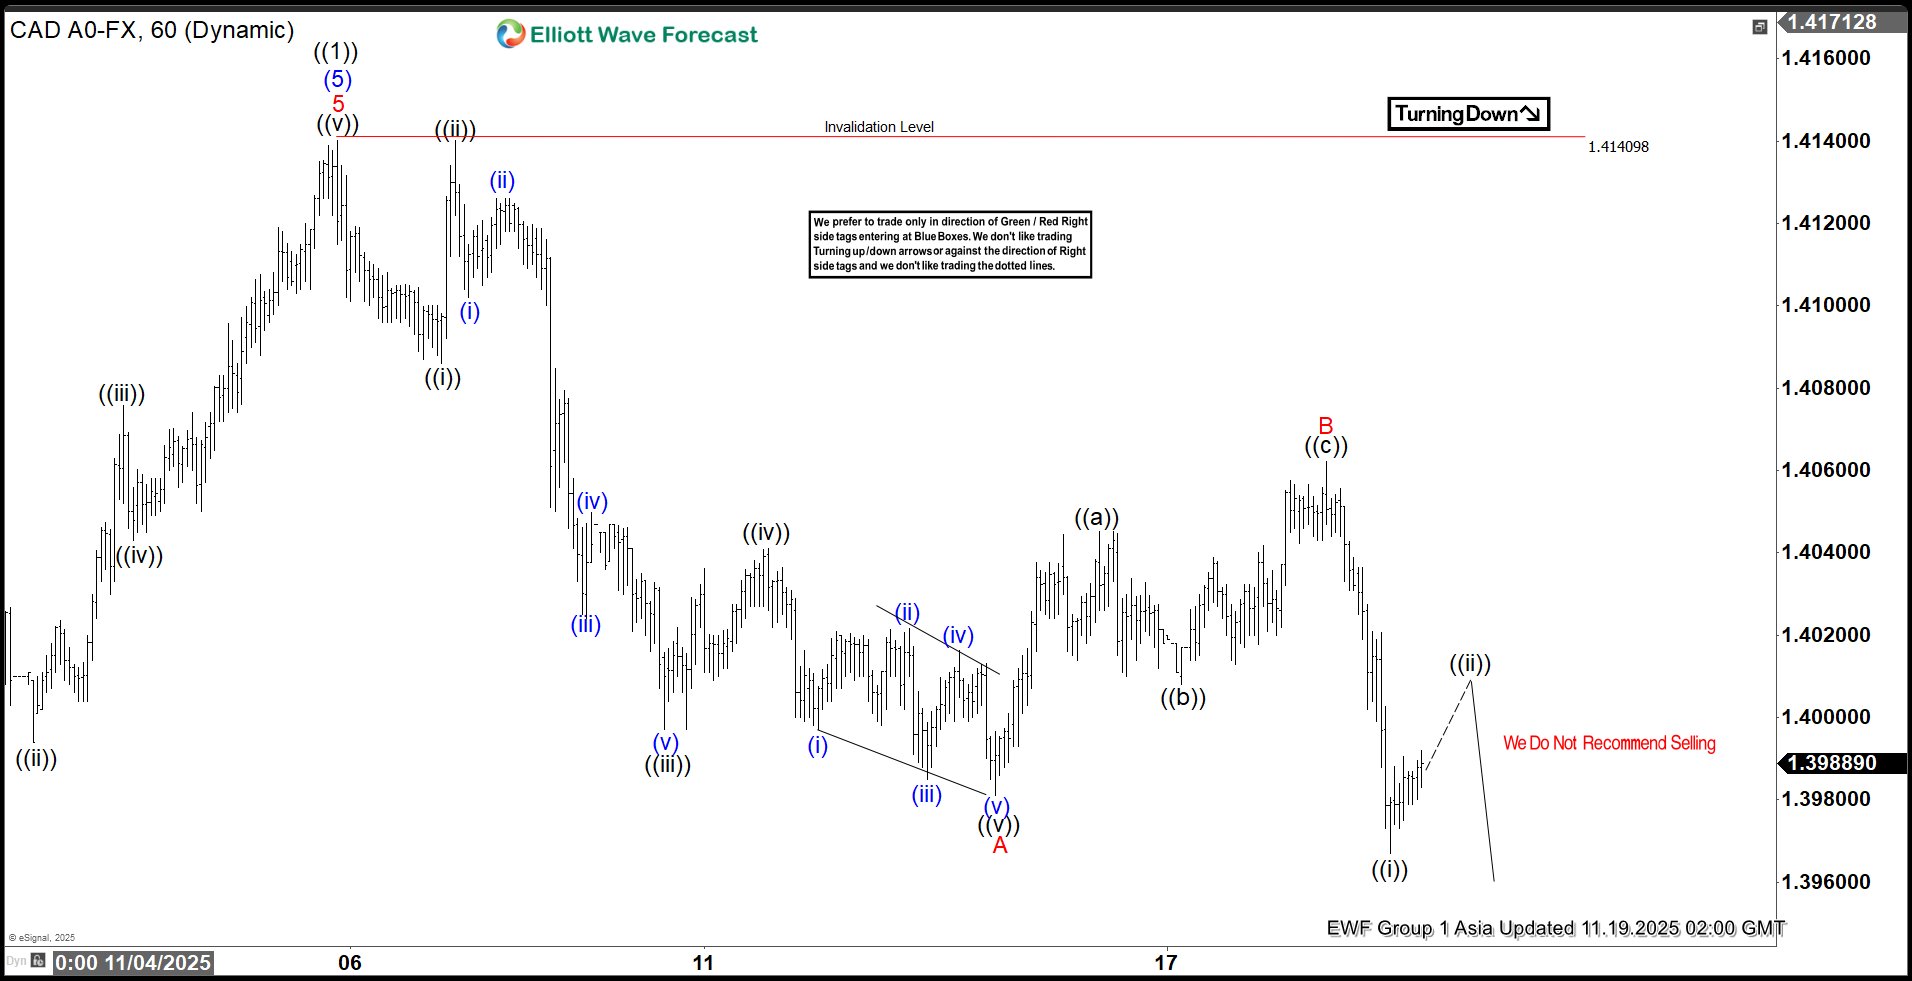
USDCAD Elliott Wave 1 Hour Chart 11.19.2025
USDCAD completed a 3-wave recovery exactly at the 50% Fibonacci zone (1.4062) and then declined as expected. Eventually, the pair broke below the previous 1.3986 low, confirming that the next leg down is in progress. As long as the price stays below the B red peak (1.4062), USDCAD is now targeting the 1.39024 area.
24/7 Expert Market Analysis in Our Trading Community
Reminder for members: Our chat rooms in the membership area are available 24 hours a day, providing expert insights on market trends and Elliott Wave analysis. Don’t hesitate to reach out with any questions about the market, Elliott Wave patterns, or technical analysis. We’re here to help.
You can find detailed information on trading setups in the membership area and in the Live Trading Room
Source: https://elliottwave-forecast.com/forex/usdcad-elliott-wave-incomplete-sequences/