Advanced Micro Devices (AMD) drives substantial growth as it expands into artificial intelligence and data center markets. OpenAI and Oracle validate its roadmap, confirming plans to deploy tens of thousands of MI450 and MI350 accelerators. These chips deliver superior performance and cost efficiency for AI inference, positioning AMD as a strong alternative to NVIDIA. Consequently, analysts forecast AMD’s revenue could reach $46 billion by 2028, with AI-related sales contributing up to $20 billion annually by 2027.
Investor confidence rises sharply. Price targets climb to $300, while bullish scenarios suggest $400 if AMD continues gaining market share. Moreover, AMD reports a 32% year-over-year revenue increase in Q2 2025, fueled by EPYC server CPUs and Ryzen processors. As demand for AI infrastructure intensifies and hyperscalers scale up. AMD’s strategic investments and partnerships strengthen its position as a leading force in next-generation tech innovation.
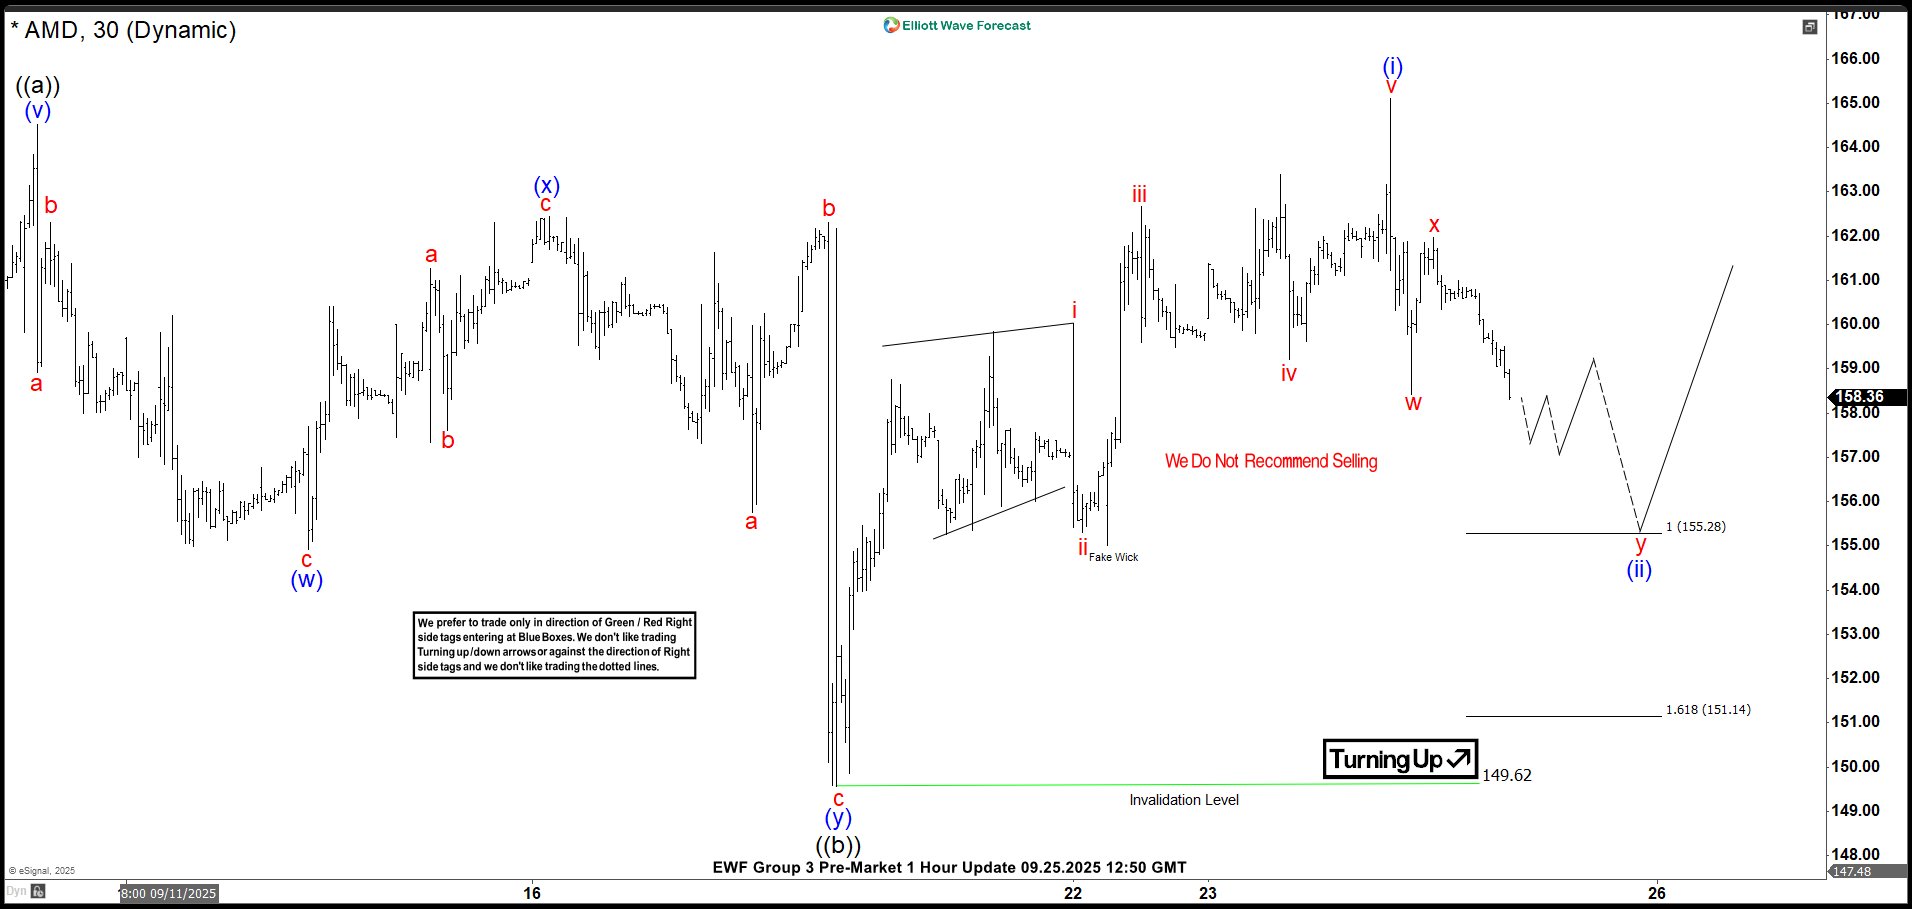
Elliott Wave Outlook: AMD 30 Min Chart September 25th
On September 25th, AMD completed a double correction labeled as wave ((b)) at the 149.62 low. Immediately after, the market rallied and formed a leading diagonal structure, which marked the end of wave (i). Then, a pullback began. At that point, we identified a potential double correction (wxy) unfolding as wave (ii). Therefore, we applied Fibonacci to define the extreme zone, which ranged from 155.28 to 151.14. Based on this setup, we anticipated a bounce that would resume the bullish trend. As long as the market stayed above 149.62, our outlook remained valid.
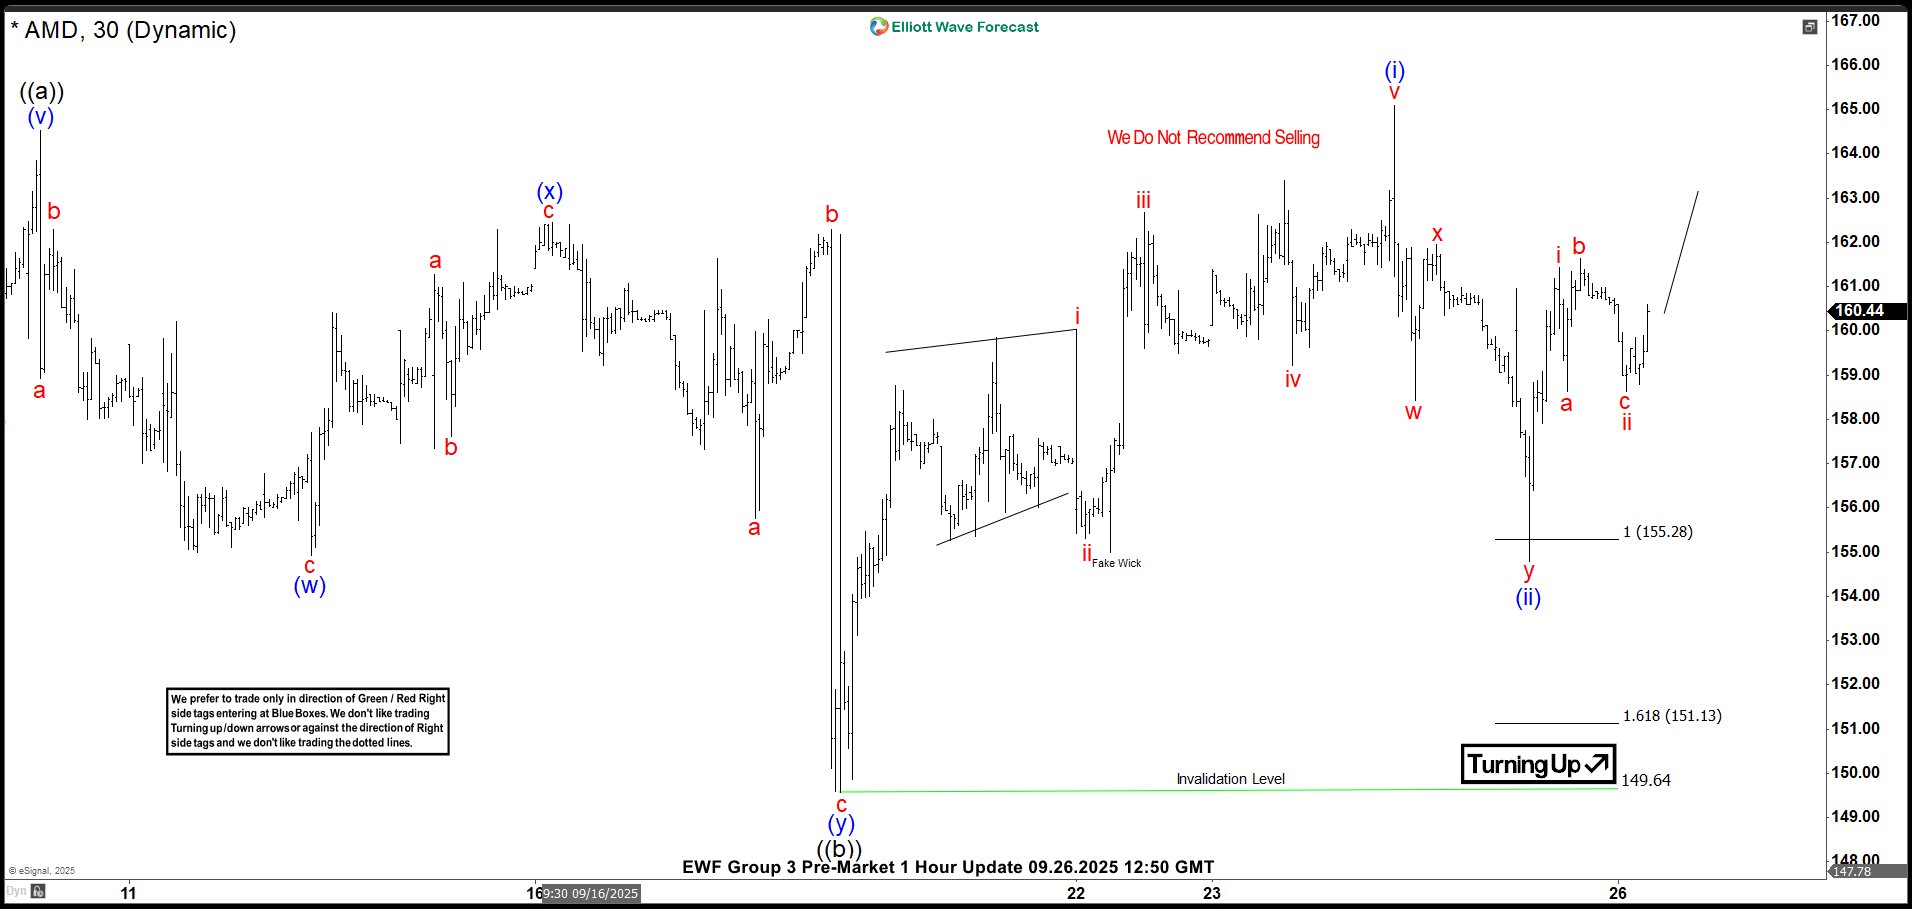
Elliott Wave Outlook: AMD 30 Min Chart September 26th
The next day, the double correction unfolded and completed wave y of (ii) within the expected zone. Immediately afterward, the bullish move began. To confirm the continuation of the uptrend, the market needed to break above wave (i). Once that happened, the probability of holding the 149.64 pivot point increased significantly.
Therefore, we looked for the market to develop an impulsive structure that could generate profits for our setup. With momentum building and technical conditions aligning, we positioned ourselves to capitalize on the upward move. If you’re eager to dive deeper into Elliott Wave Theory and learn how its principles apply to market forecasting, you might find these resources helpful: Elliott Wave Education and Elliott Wave Theory.
Elliott Wave Outlook: AMD 1 Hour Chart October 17th
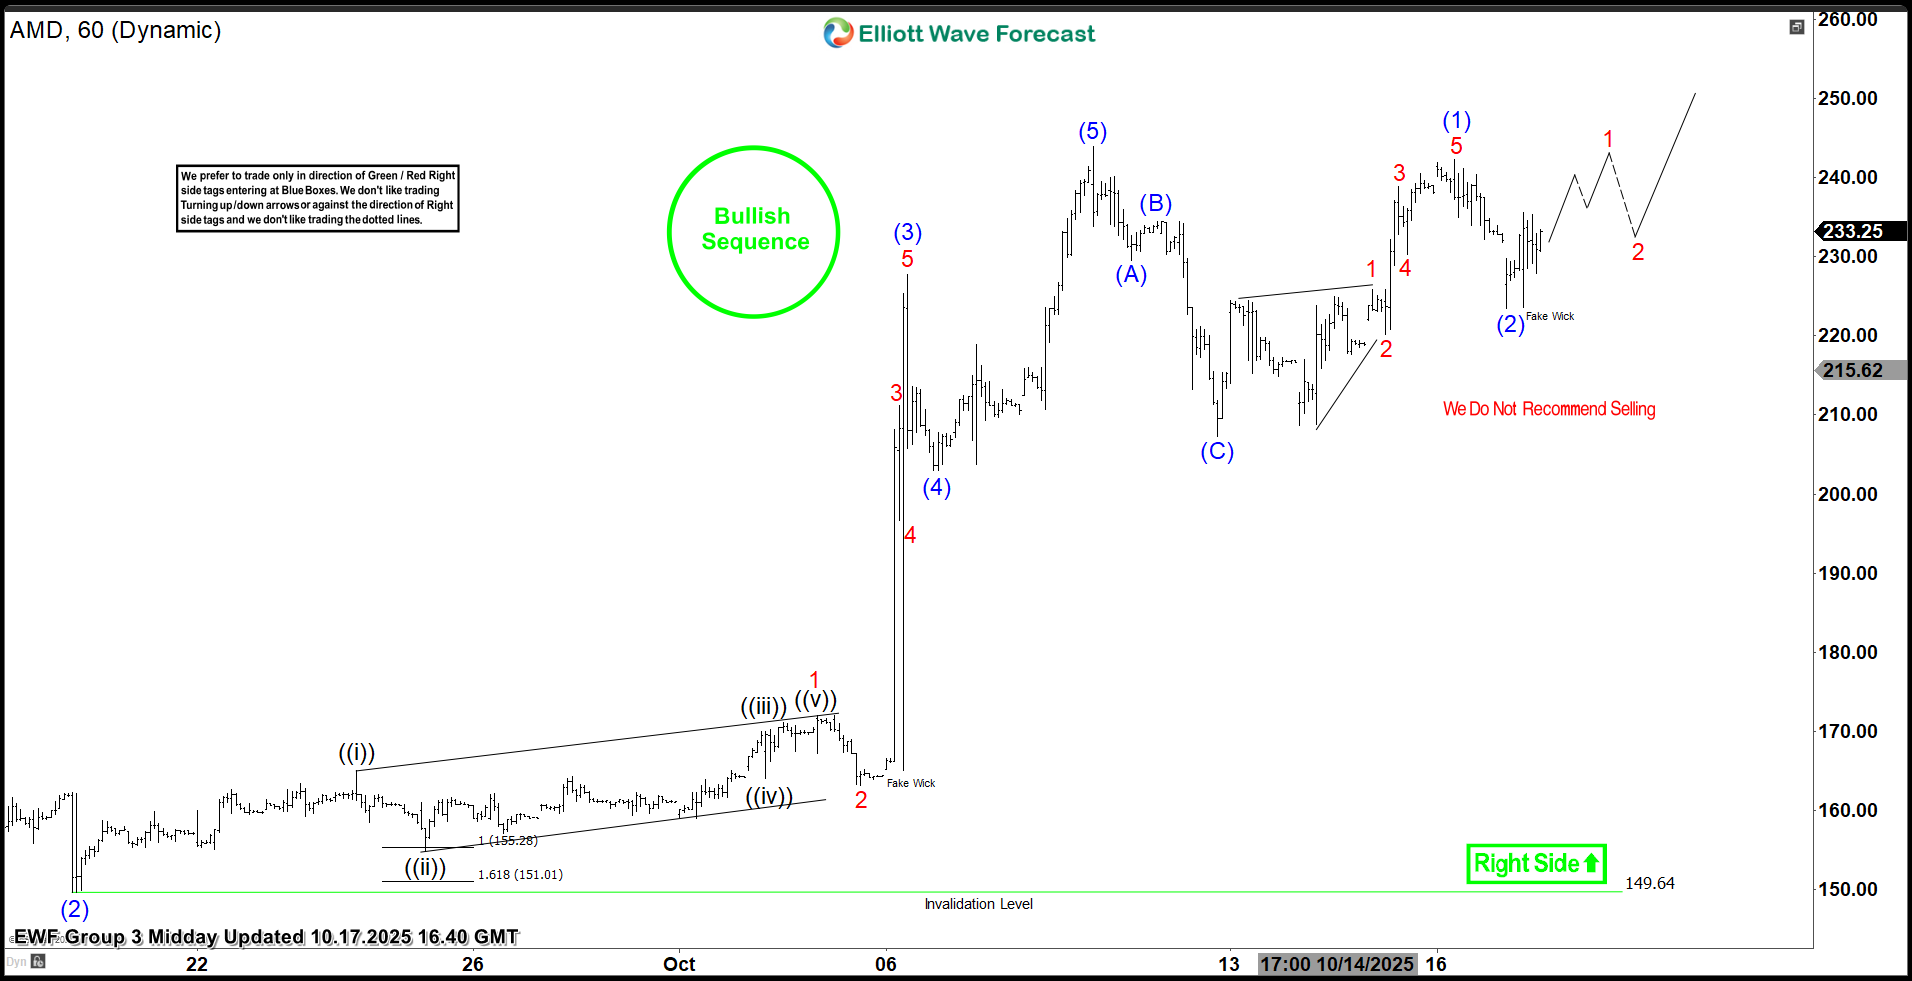
This is the latest update on AMD. We can clearly see the small extreme zone where we entered our buy position. Shortly after, the market made a strong bullish move, prompting us to adjust the count to a significant impulsive wave. That impulse remains active and should continue driving the rally.
This setup highlights the difference between short-term trading and the behavior of day traders. After one month, AMD has climbed nearly $100, while a day trader likely exited around $160. Many chase quick riches and trade as if there’s no tomorrow—but that approach rarely works. What truly works is a solid setup, disciplined risk control, fractal awareness, and at least a one-month outlook. In the end, long-term investors win—especially when they choose companies with strong market positioning and long-term vision.
Source: https://elliottwave-forecast.com/stock-market/setup-payoff-amd-explosive-100-rally/