
The VanEck Semiconductor ETF (SMH) trades within the forecasted extreme zone of 309.83 to 353.03, showing signs of technical overheating. Analysts expect an average 12-month price target of 343.93, with bullish projections reaching up to 451.50. Strong demand for semiconductors—driven by AI, electric vehicles, and cloud infrastructure—continues to push momentum. All major moving averages, from the 10-day to the 200-day, point to a “Buy” signal. At the same time, indicators like RSI and STOCH suggest overbought conditions. Traders should watch for signs of consolidation or a pullback before the next leg higher.
From October 2025 into early 2026, SMH’s direction depends on interest rate trends, chip supply dynamics, and earnings from top holdings such as NVIDIA, TSMC, and Broadcom. The ETF holds a “Moderate Buy” rating, backed by 22 buy recommendations and 4 holds. While long-term growth in semiconductors looks solid, short-term risks may surface from global tensions or cyclical shifts. New investors might wait for clearer support levels or a dip before entering. Those already in the trade could protect gains by trimming positions or setting stop-loss levels as SMH moves through this high-risk zone.
Elliott Wave Outlook: SMH Daily Chart May 13th
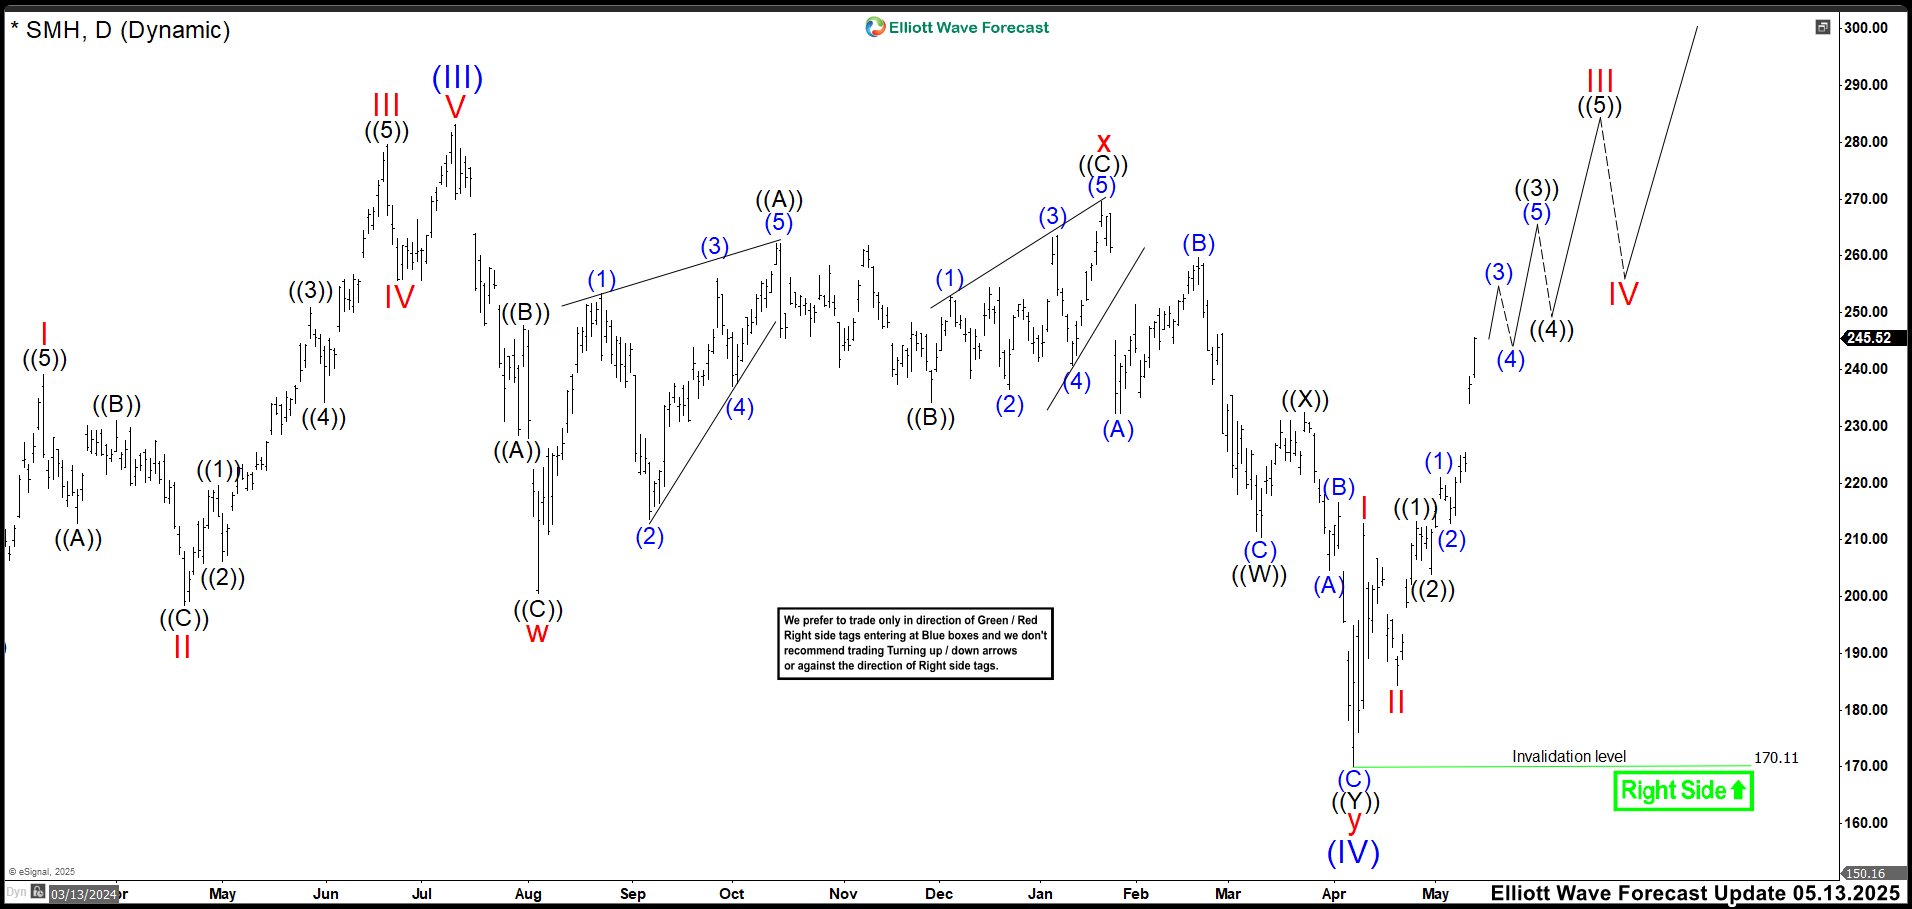
SMH recently completed a complex double correction (w, x, y), confirming the shift from a failed zigzag (a, b, c) to a deeper structural reset. The breach of wave ((A)) by wave ((C)) and the August 2024 low signaled this transition early, with wave w ending at 200.49, wave x peaking at 269.66 through two diagonal formations, and wave y bottoming at 170.11—right within the Fibonacci extension zone of 186.80 to 167.22. From that low, SMH began a clear impulsive move upward, reinforcing the bullish outlook. As the structure unfolded, corrections in 3, 7, or 11 swings were expected to support the trend. Therefore, buying the dips was the preferred strategy while momentum was holden.
We analyzed to focus on the 309.83 to 353.03 zone as a likely target for wave (V) to complete. This range marks a critical threshold where bullish exhaustion could trigger a broader market correction. With the impulse in motion and technical patterns aligning, traders should stay alert for signs of topping behavior once SMH approaches this zone. The setup favors continued upside in the near term, but disciplined risk management will be key as the ETF enters historically reactive levels.
Elliott Wave Outlook: SMH Daily Chart September 27th
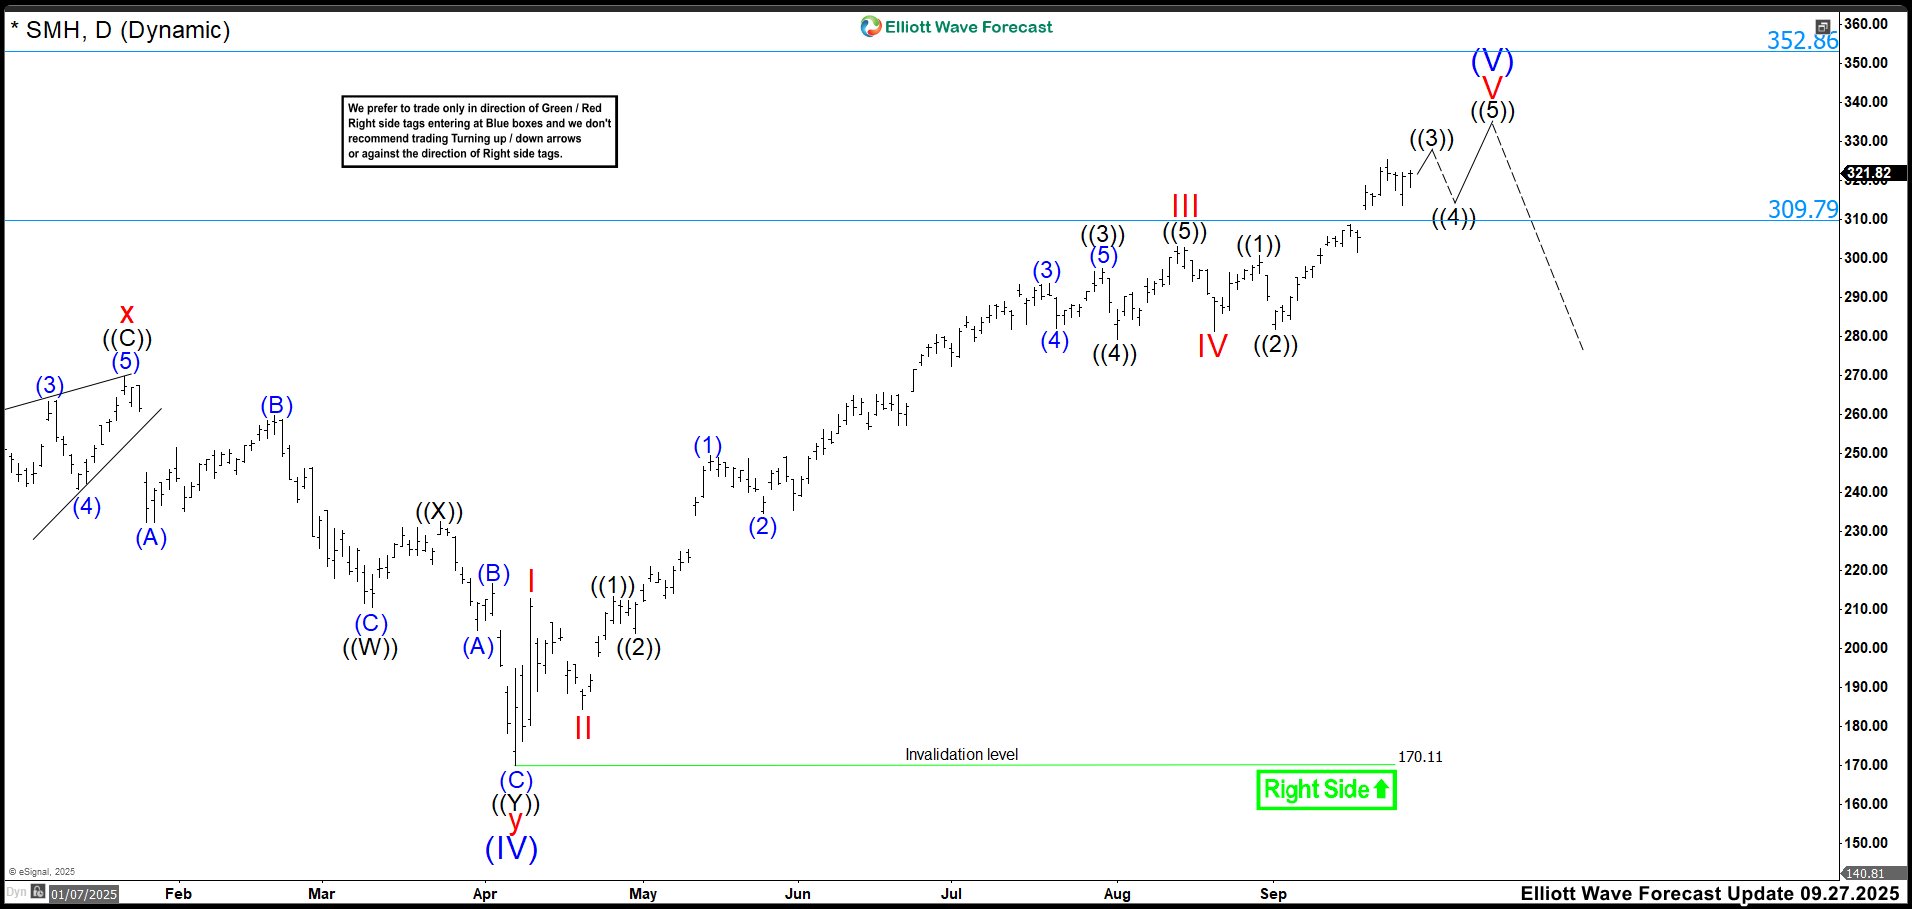
SMH continues to push through a strong impulsive structure. All signs suggest wave V is already in motion. The weekly chart hints at wave III still unfolding, but we are going to assume a conservative mood for now. The structure from the 170.11 low remains solid. Bullish momentum dominates unless proven otherwise. We expect wave ((3)) to peak by late September. A swift correction in wave ((4)) may follow through October. If the pattern holds, November and December could bring a final rally. A broader reset may begin in early 2026.
SMH now trades inside the critical 309.83–353.03 zone. This area often signals exhaustion and potential reversal. Traders must stay alert and act with precision. The wave V structure looks clean and actionable. The strategy remains simple: buy dips after corrections in 3, 7, or 11 swings. Momentum still favors the bulls, but risk increases inside this zone. A sharp correction could unfold at any moment. Watch for signs of topping or failed breakouts. Discipline and tactical awareness are essential. Ride the impulse while it lasts but stay ready to pivot.
Source: https://elliottwave-forecast.com/stock-market/extreme-smh-hold-take-profits/