
In this technical blog, we will look at the past performance of 1 hour Elliott Wave Charts of XME. We presented to members at the elliottwave-forecast. In which, the rally from 28 January 2022 low unfolded as an impulse structure. And showed a higher high sequence favored more upside extension to take place. Therefore, we advised members not to sell the ETF & buy the dips in 3, 7, or 11 swings at the blue box areas. We will explain the structure & forecast below:
XME 1 Hour Elliott Wave Chart
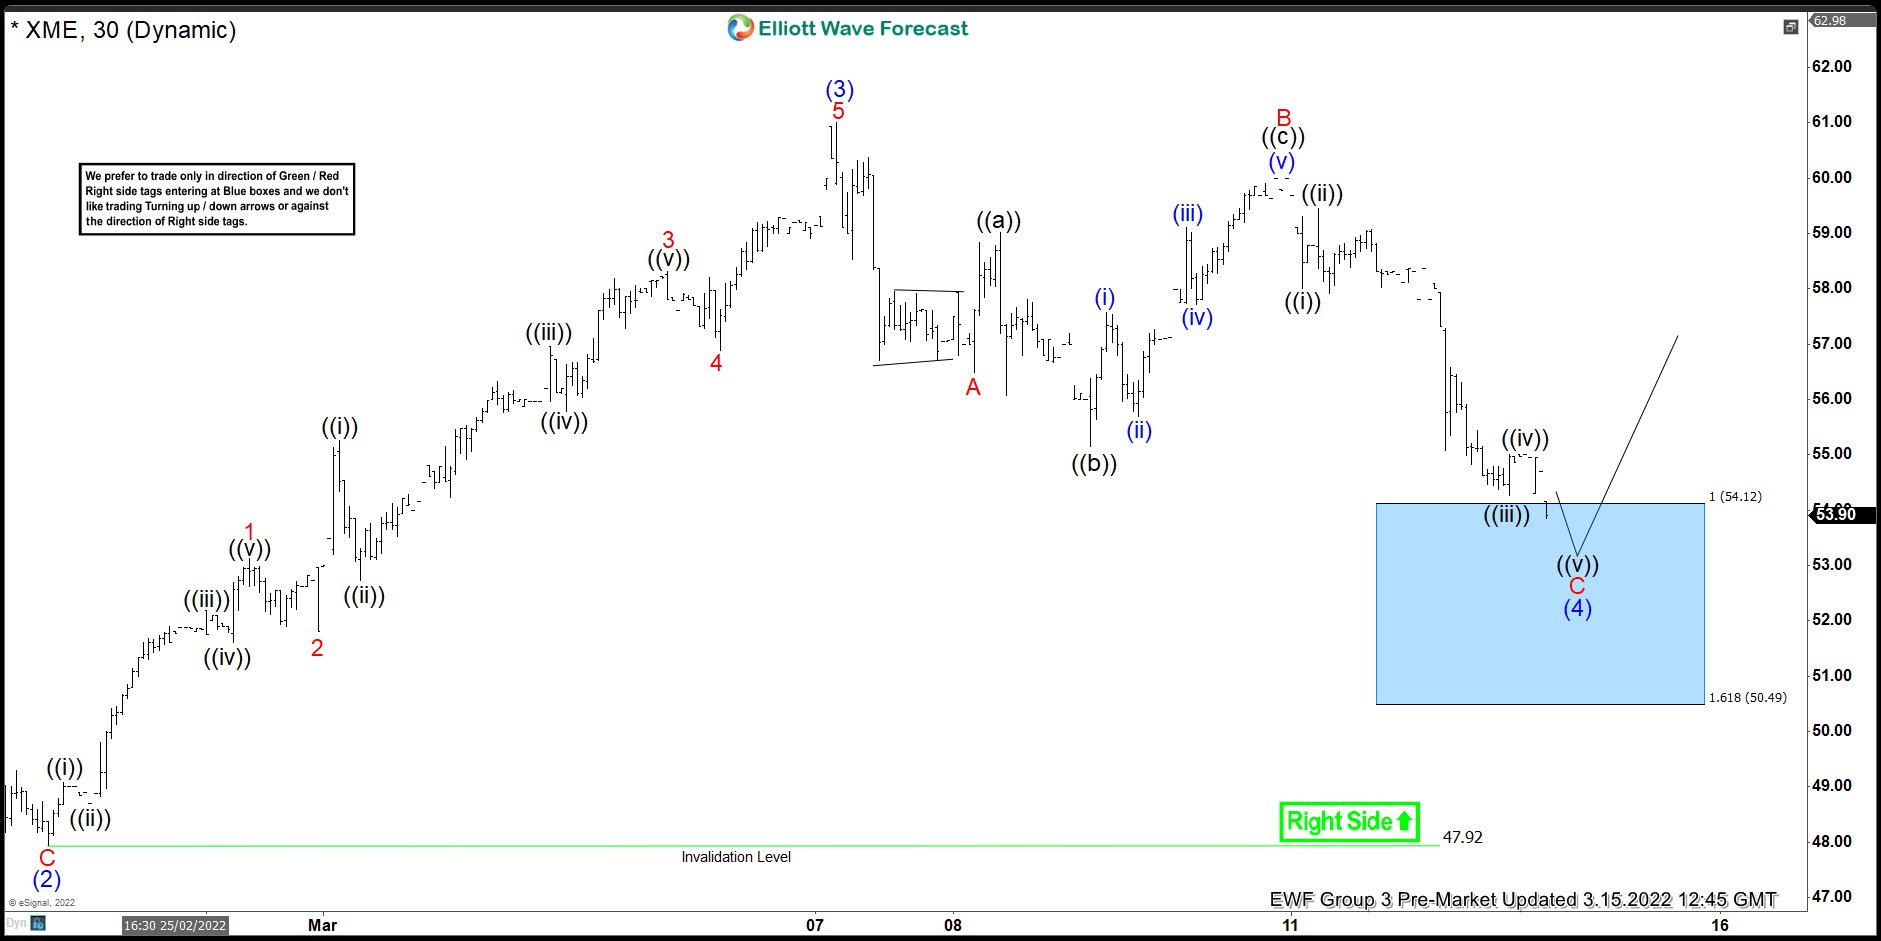
Here’s 1hr Elliott wave chart from the 3/15/2022 Pre-Market update. In which, the cycle from 2/24/2022 low ended in wave (3) as an impulse structure at $61 high. Down from there, the ETF made a pullback in wave (4) to correct that cycle. The internals of that pullback unfolded as Elliott wave zigzag structure where wave A at $56.48 low. Wave B ended at $60 high and wave C managed to reach the blue box area at $54.12- $50.49 area. From there, buyers were expected to appear looking for the next leg higher or for a 3 wave bounce minimum.
XME Latest 1 Hour Elliott Wave Chart
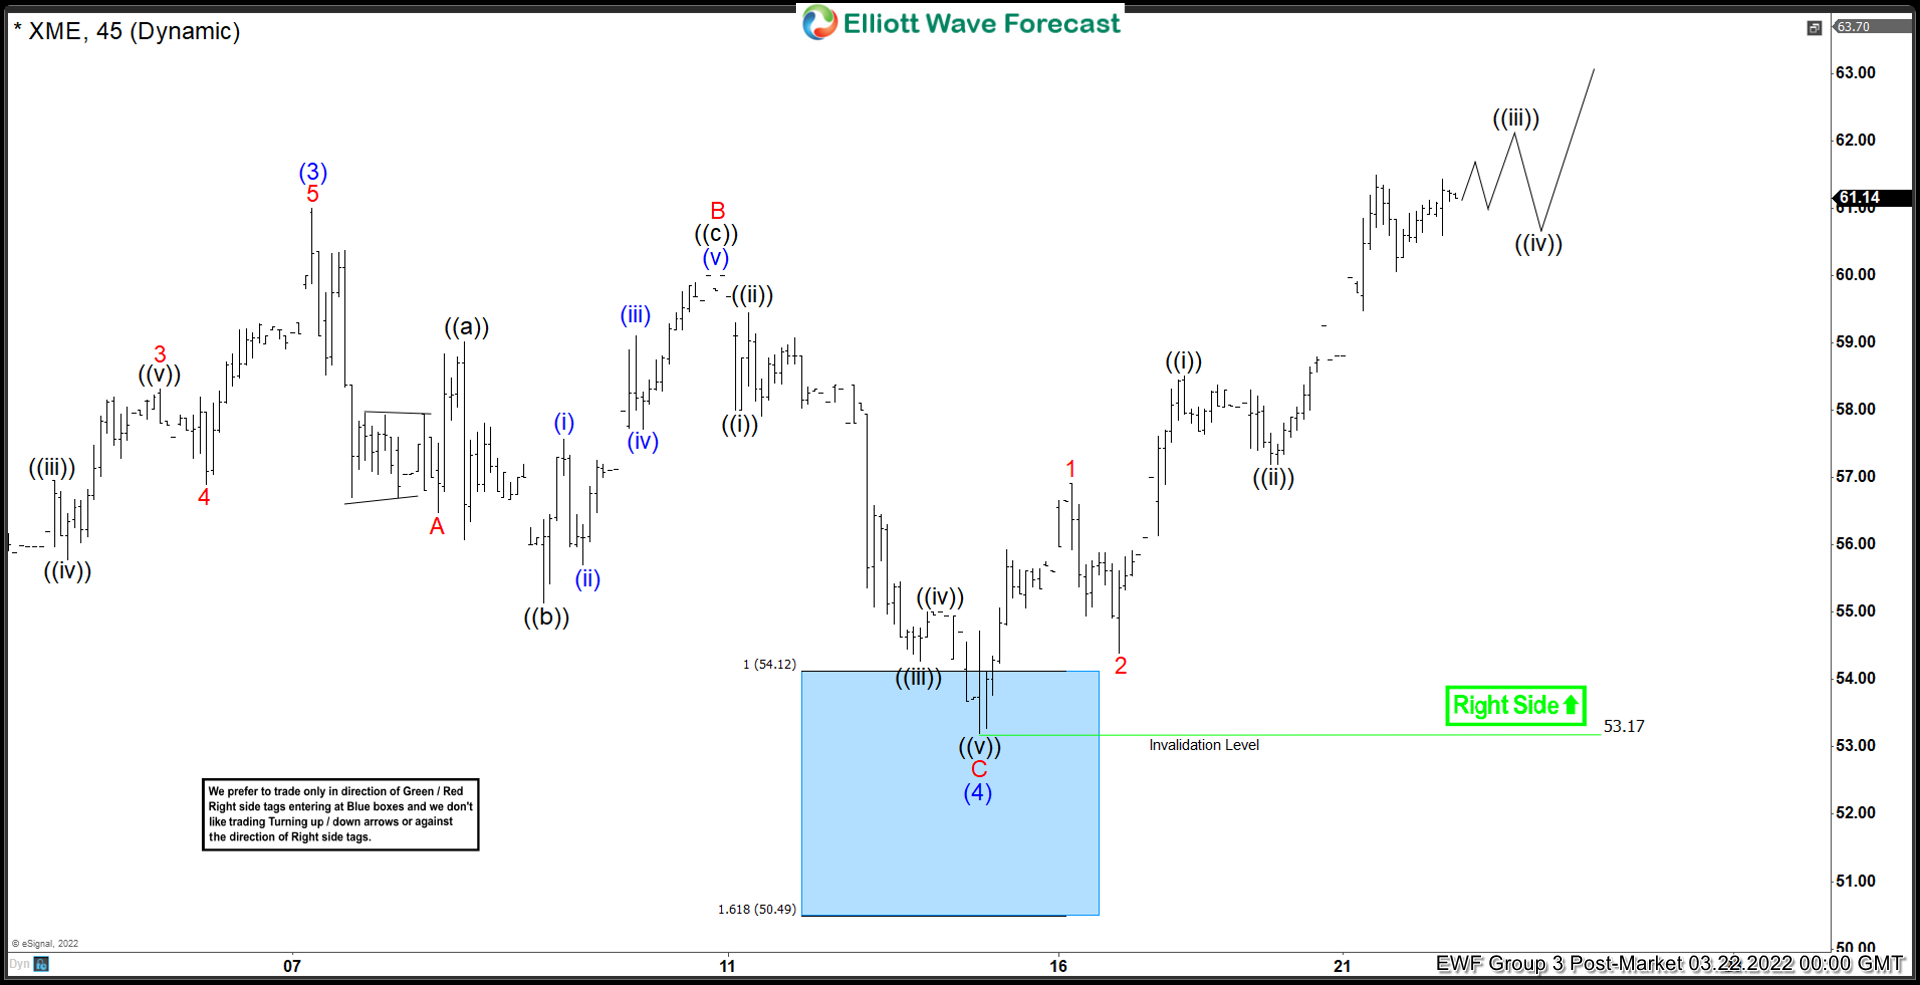
This is the latest 1hr Elliott wave Chart from the 3/22/2022 Post-Market update. In which the ETF is showing a strong reaction higher taking place, right after ending the zigzag correction within the blue box area. Allowed members to create a risk-free position shortly after taking the long position at the blue box area.
Source: https://elliottwave-forecast.com/stock-market/xme-reacting-higher-blue-box/