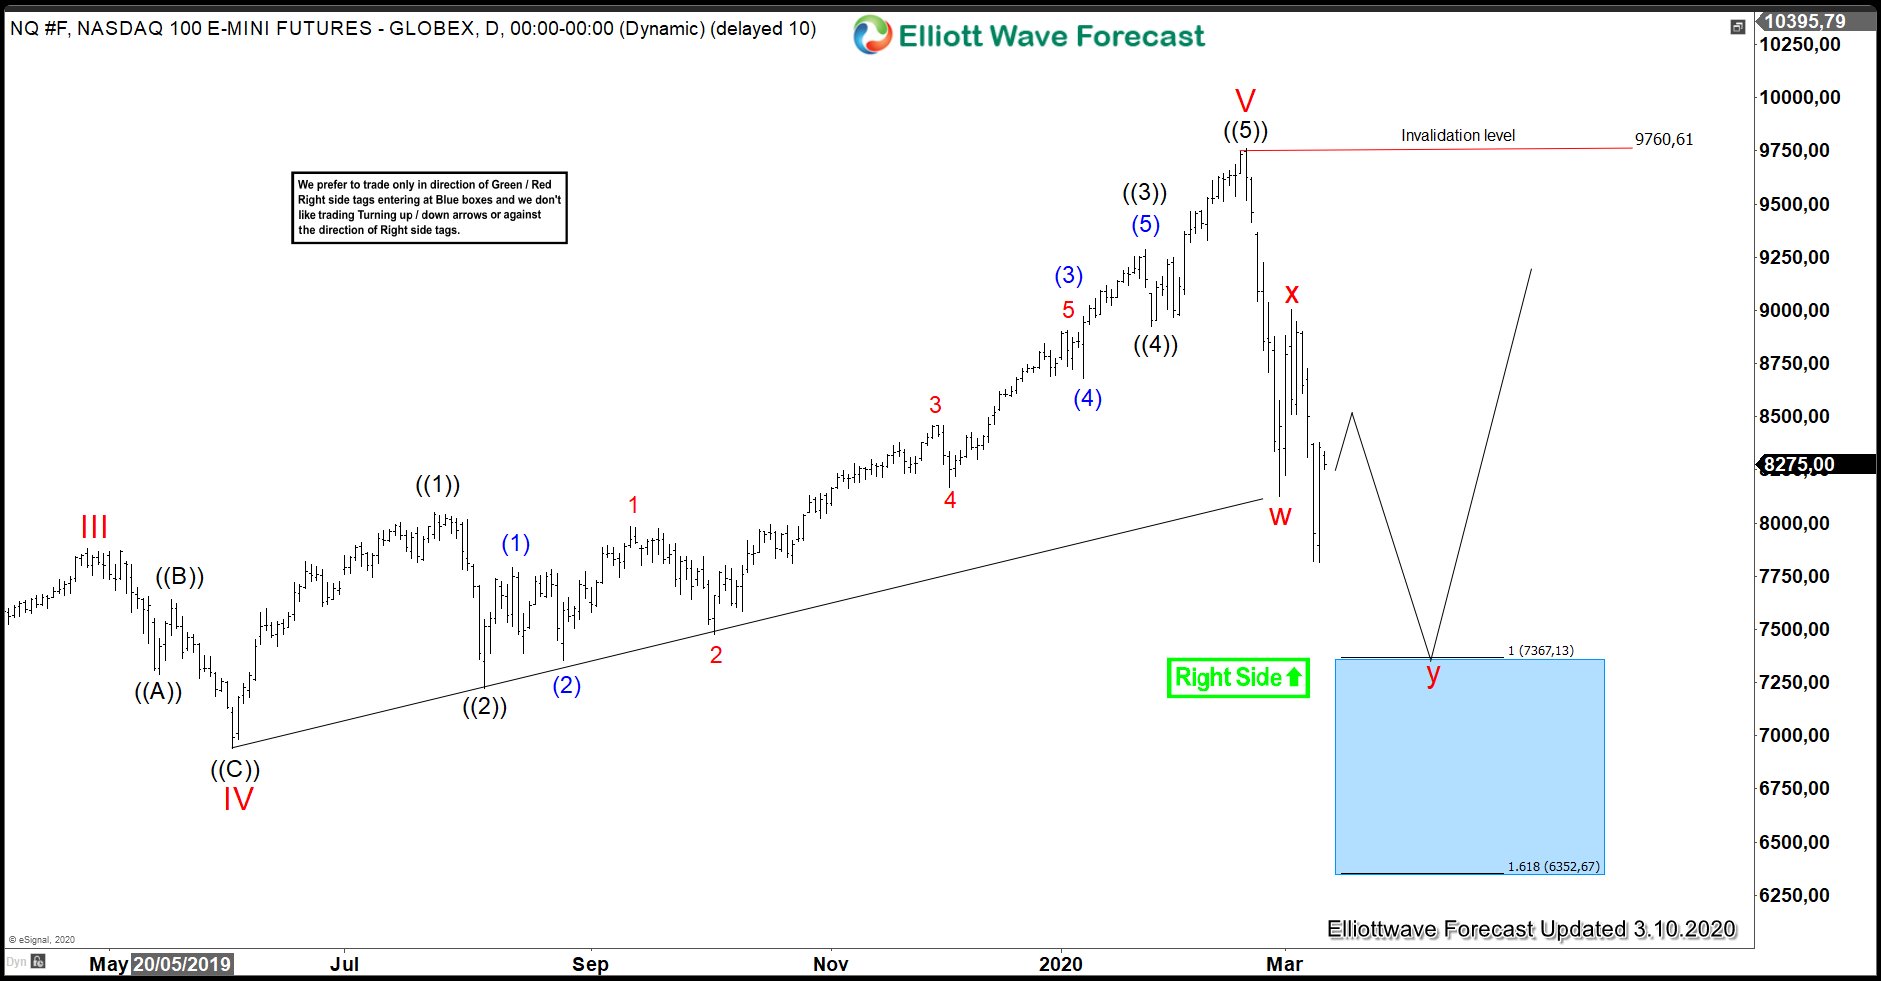
In this blog, we are going to take a look at the Elliottwave chart of NASDAQ. Based on the daily chart shown below, NASDAQ has ended the rally from 2009 low at 9760.61 high. The index is now correcting that cycle. The correction is unfolding as a double three and has an incomplete sequence. The index has not reached the 100% -161.8% extension at 6352-7367 area. We are showing this area with a blue box. The blue box is the area where we expect the correction to end and buyers to appear for an extension higher or 3 waves bounce at least.
NASDAQ Daily Elliott Wave Update
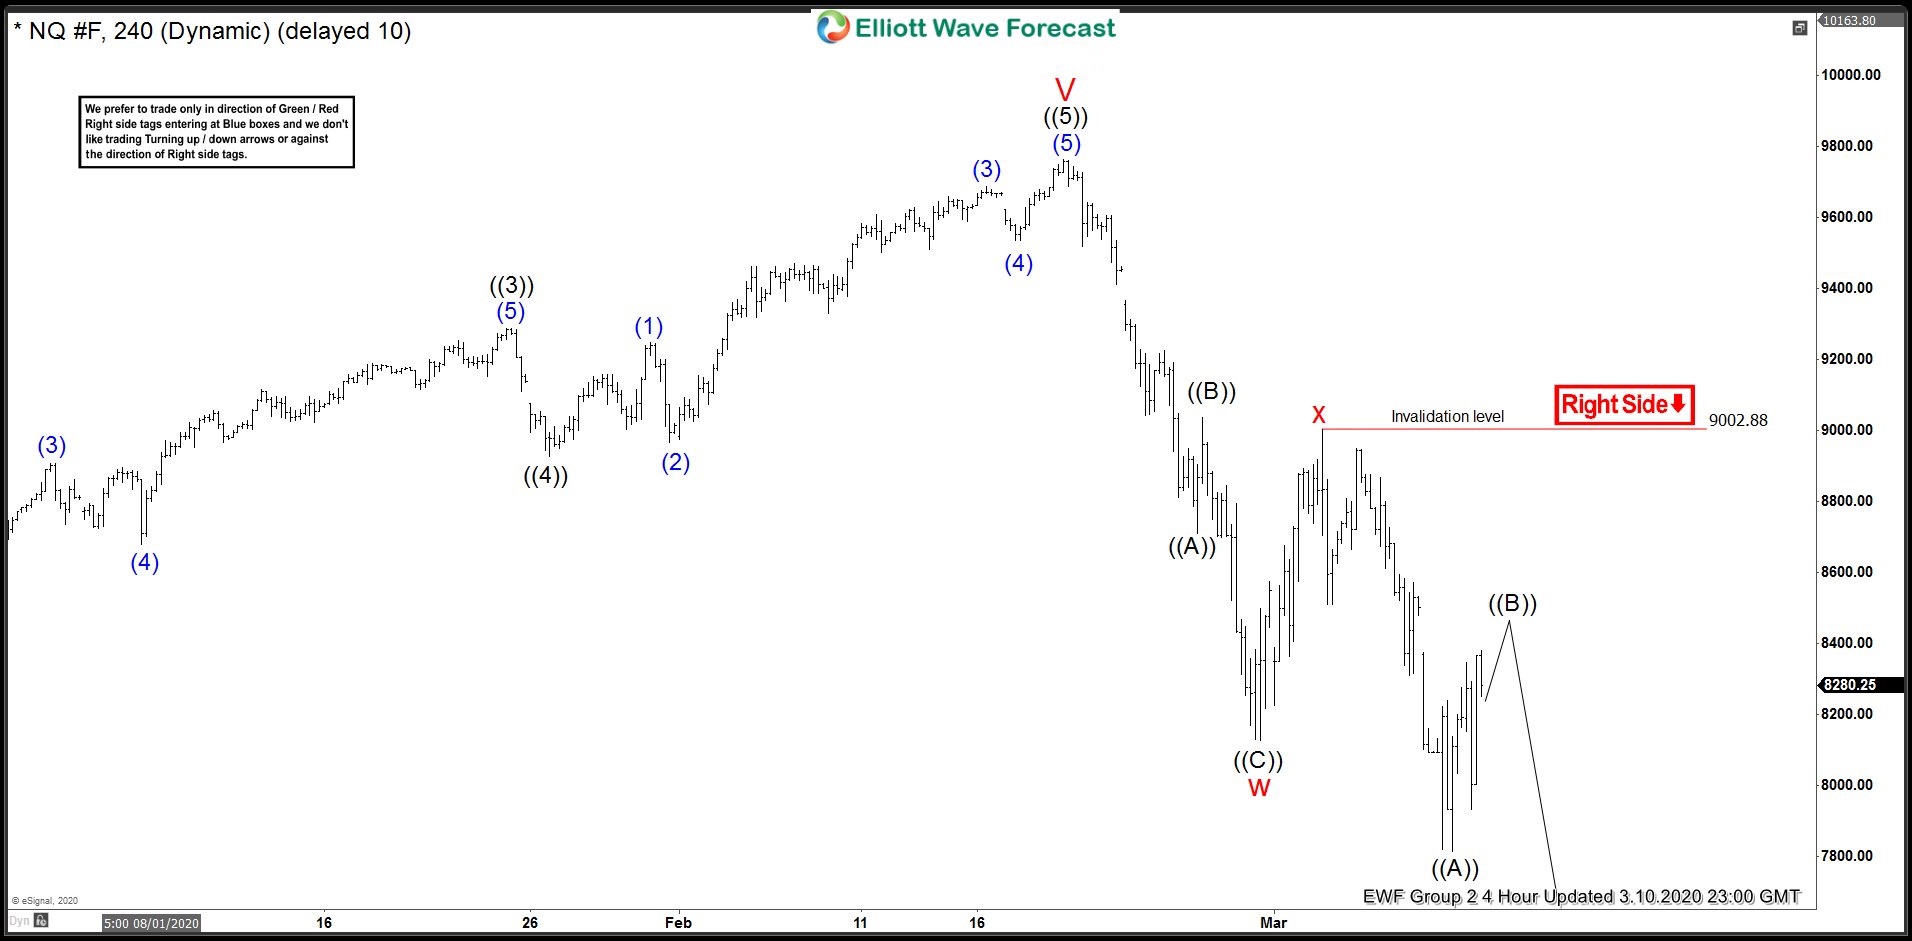
The 4 hour chart below shows that wave w ended at 8126.25 low and unfolded as a zig-zag. Wave ((A)) of w ended at 8709.50 low. The index then bounced in wave ((B)) and ended at 9037.50 high. Afterwards, the index extended lower and ended wave ((C)) at 8126.25 low. The bounce in wave x ended at 9002.50 high.
From there, the index has continued to extend lower. It has broken below previous wave w low to confirm that wave y is in progress. Wave ((A)) of y has ended at 7814.25 low. The index is doing a bounce in wave ((B)) right now. As long as the pivot at 9002.88 high stays intact, expect the bounce in 3,7, or 11 swings to fail. The index then has the scope to continue lower in wave ((C)) until it reaches the equal leg blue box area. That area should see some support for a 3 waves bounce at least.
NASDAQ 4 hour 3.10.2020 Elliott Wave Update