
In this technical blog, we are going to take a look at the past performance of 1-hour Elliott Wave Charts of Dow Jones Futures ($YM_F), which we presented to members at elliottwave-forecast.com. In which, the cycle from 12/26/2018 low ( $21452) unfolded in an impulse structure & showed a higher high sequence in bigger time frame charts called for further upside. Also, it’s important to note that the $YM_F was having green right side tag pointing higher favored members to look for buying opportunity at the blue box areas in 3, 7 or 11 swings. We will explain the ideas & structure below:
$YM_F 1 Hour Elliott Wave Chart
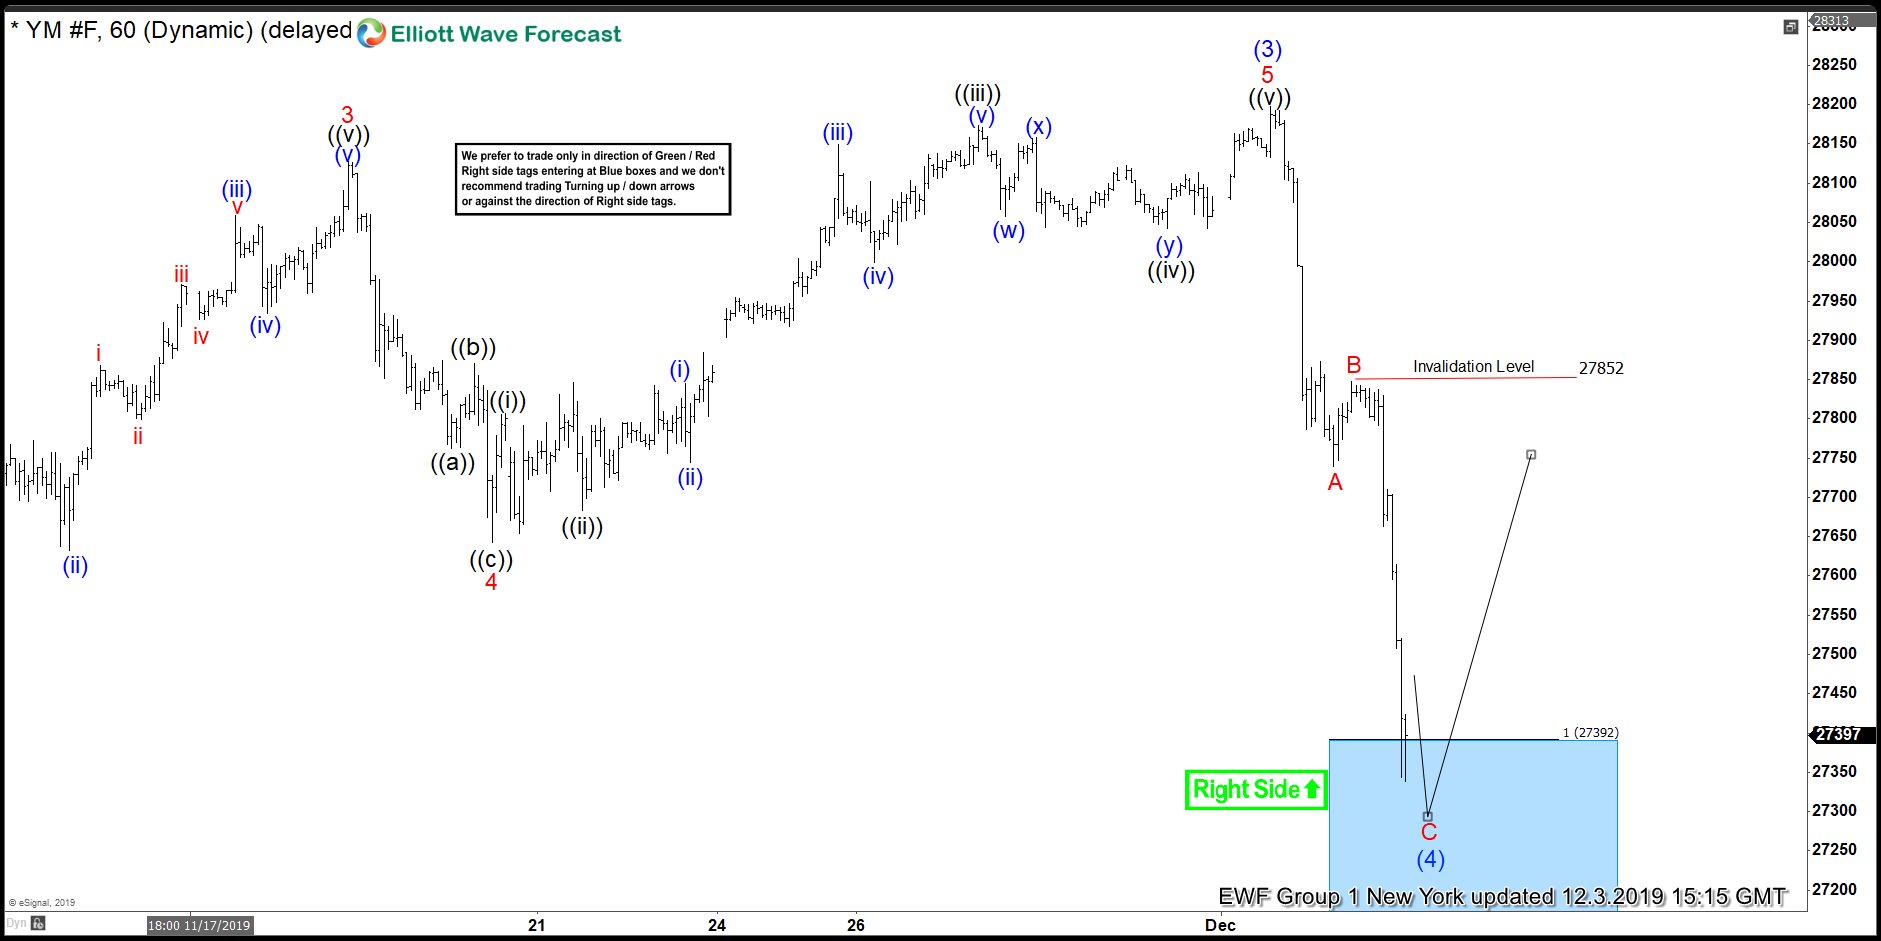
$YM_F 1 Hour Elliott Wave Chart from 12/03/2019 NY update, in which the cycle from 10/03/2019 low unfolded in an impulse structure where wave 1 ended at $27088. Wave 2 ended at $26588 low, wave 3 ended at $28128 high, wave 4 ended at $27643 low and wave 5 ended at $28197 high thus completed wave (3). Down from there, the index made a sharp decline in wave (4) pullback to correct the rally from 10/03/2019 low before a rally could resume higher again. The internals of that pullback unfolded as zigzag structure where wave A ended at $27740 low. Wave B ended at $27852 high and wave C managed to reach the blue box area at $27392-$27284 100%-123.6% Fibonacci extension area of A-B. Thus offered our members a buying opportunity looking into more highs or for 3 wave reaction higher at least.
$YM_F 1 Hour Elliott Wave Chart
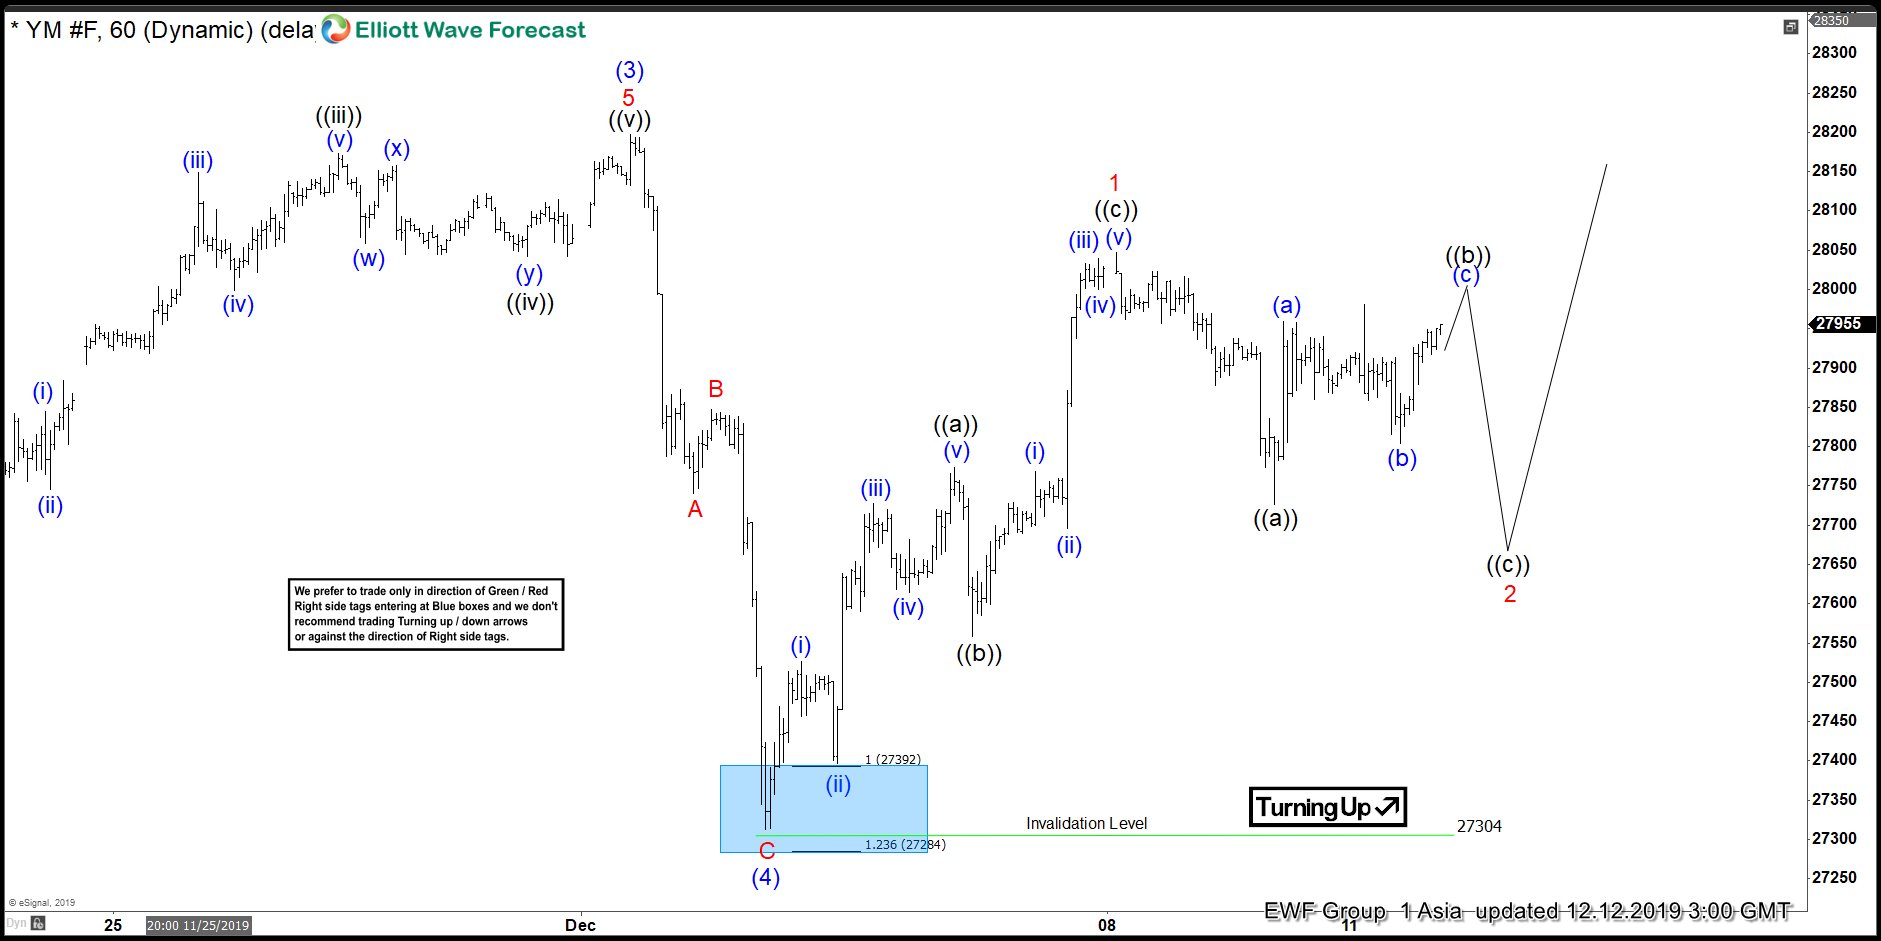
We did show the idea of 7 swings lower in wave (4) after the reaction from the blue box but made it clear that after 3 swings in the correction, 7 swings don’t need to happen so any longs from blue box would want to stay long with a risk free position. Later on, we discarded the idea of 7 swings lower in the correction based on market correlation and here’s $YM_F 1 Hour Elliott Wave Chart from 12/12/2019 Asia update, in which the index is showing reaction higher taking place from the $27392-$27284 blue box area as we expected. Allowed members to create a risk-free position shortly after taking the trade. Since than the index has bounced strongly & managed to made a new high above 12/02/2019 peak confirming the next extension higher.