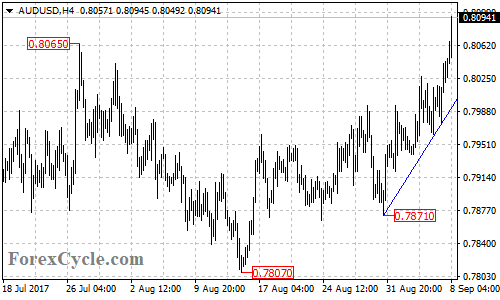
AUDUSD extends its bullish movement from 0.7871 to as high as 0.8095, breaking above the previous high resistance at 0.8065.
On the upside
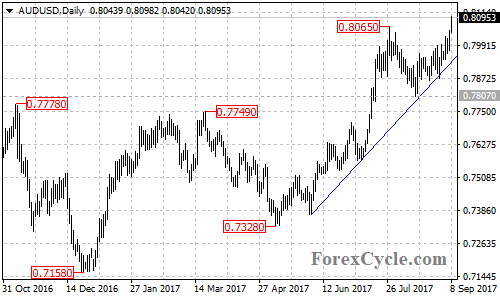
There is a bullish trend line with support at around 0.7990 on the 4-hour chart. There is also another bullish trend line on the daily chart now at 0.7930. As long as the price is above these trend lines, the upside movement could be expected to continue and next target would be at the May 2015 high of 0.8162, followed by the 38.2% Fibonacci retracement taken from the July 2011 high of 1.1080 to the January 2016 low of 0.6826 at 0.8450.
On the downside
A clear break below the trend line on the 4-hour chart will indicate that the short term uptrend from 0.7871 is complete, then the following correction pullback could bring price back towards the bullish trend line on the daily chart, a breakdown below this trend line could signal completion of the longer term uptrend form 0.7328, then next support level would be at 0.7807, followed by 0.7700.
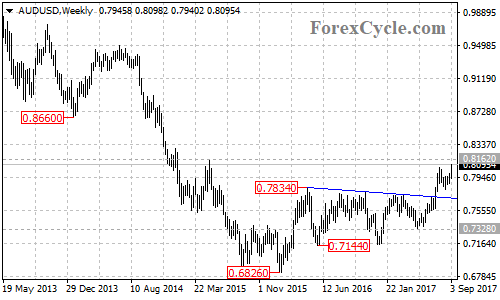
There is a resistance-turned-support trend line at around 0.7700 on the weekly chart, which acts as the key support for the bullish movement from 0.6826. Below this level could signal completion of the uptrend, then the AUDUSD pair would find support at 0.7328.
Technical levels
Support levels: 0.7990 (the bullish trend line on the 4-hour chart), 0.7930 (the bullish trend line on the daily chart.), 0.7807 (the August 15 low), 0.7700 (the resistance-turned-support trend line on the weekly chart), 0.7328 (the May 9 low), 0.7144 (the May 2016 low), 0.6826 (the January 2016 low).
Resistance levels: 0.8162 (the May 2015 high), 0.8450 (the 38.2% Fibonacci retracement).