
XAUUSD recently broke above the support-turned-resistance trend line at 1237 on its daily chart, indicating that the downside movement from 1295.94 had completed at 1204.77 already.
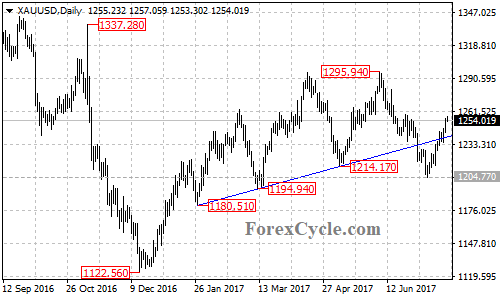
On the upside
On the 4-hour chart, the gold price ran in a bullish price channel with support at the bottom trend line at around 1241. As long as the price is in the channel, the bullish move could be expected to continue after a minor consolidation and further rise to test the first resistance level at 1258.78 is possible. A break above this level could take price to retest the important psychological level at 1300.
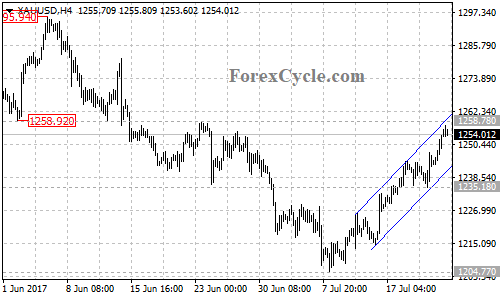
On the downside
If the gold price failed to break above 1258.78 resistance, the correction pullback could bring price back to the bottom trend line of the price channel. A clear break below the channel support will suggest that the uptrend is complete, then the pair will find support at 1235.18. Below this level will confirm that the downtrend from 1295.94 has resumed, this could trigger another fall towards 1167.
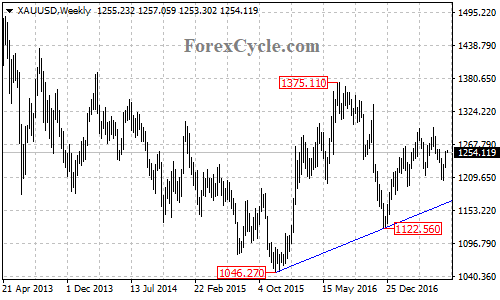
There is an import support trend line on the weekly chart now at around 1167. This level would become the final target of the bearish movement. Strong rebound could be expected after touching this trend line support.
Technical levels
Support levels: 1241 (the bottom trend line of the price channel on the 4-hour chart), 1235.18 (the July 20 low), 1204.77 (the July 10 low), 1167 (the support trend line on the weekly chart).
Resistance levels: 1258.78 (the June 23 high), 1300 (the important psychological level).