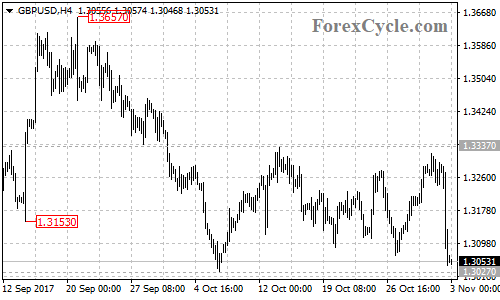
GBPUSD failed in its attempt to breakout of 1.3337 resistance and dropped sharply to 1.3040 area, facing the major support trend line on the daily chart. A clear break below this trend line will suggest that the upside movement from 1.1946 (Oct 2016 low) had completed at 1.3657 already, then next target would be at 1.2774 (Aug 24 low). Near term resistance is at 1.3135, only break above this level could indicate that lengthier sideways movement in the trading range between 1.3027 and 1.3337 is needed, then another rise to retest 1.3337 resistance could be seen.