Most of the phenomena we encounter in our daily lives occur in cycles. This is the case with seasons, the rising and setting of the sun, the ebb and flow, day and night, the earth revolving around the sun, etc. We take these for granted and rarely think of them in terms of cycles. Furthermore, we seldom associate cycles with forecasting. Today, we have accurate instruments to predict certain future events, which range from weather storms to collisions in space and the next tsunami or earthquake.
The underlying factor in this forecasting is a series of repeated cycles on the basis of which we form our hypotheses. The same method is applied to market analysis. We can use market cycle theory to forecast the evolution of financial markets, i.e. we can predict when the low and high of a cycle will occur. Using this information, we can thereby outline our trading strategy.
What is market cycle?
Let us first understand the basic concept of a market cycle. Imagine a price moving up and down depicted on a chart in the form of a wave. The bottom of the wave is the low point and the top of the wave is the high point. Each low point is connected to a high point, i.e. crest of the wave. The time between two low points or two high points can be regarded as a cycle. Imagine this like the longest day of summer and the next longest day of sumer next year in a cycle of seasons. Frequently repeating cycles over a period of time are used to define a trend and trends are used as the basis for forecasting and therefore investment.
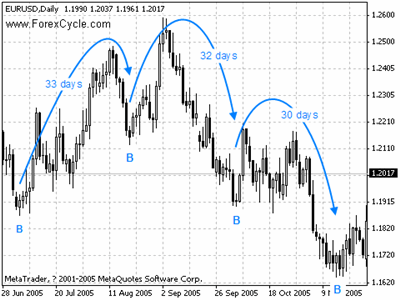
The figure below is a Euro/USD daily chart, which shows that, in every 30 to 33 days, the price of Euro/USD will come to an obvious low.
Market cycles fall into different multiple groups, i.e. short, medium and long-term cycles. Medium and long-term cycles are used in long-term FOREX analysis, encompassing 20-40 days and 30-50 weeks respectively. Short-term FOREX analysis involves a short-term period of 100-400 hours. In Long Term Forex Market Analysis section, we normally use medium-term with 25-35 days in length and long-term cycle with 35-45 weeks in length. Also short-term cycle with 160-320 in length is used in Short Term Forex Market Analysis. You are likely to come across even shorter cycles, but long-term cycles are most widely used to determine the market’s high and low, namely when to buy and sell.
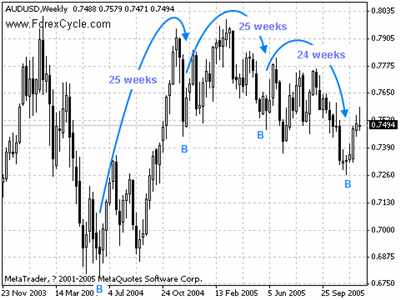
The figure below is a weekly chart of AUS/USD, which shows that, the price of AUS regularly moves to a cycle bottom in every 25 weeks.
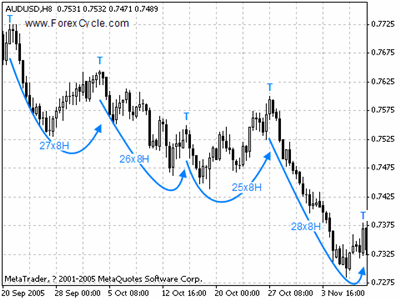
The same thing happens in the chart of shorter period, for example, 8-hour chart of AUS/USD as below. The cycle tops appeared regularly one after another in every 200 to 250 hours.