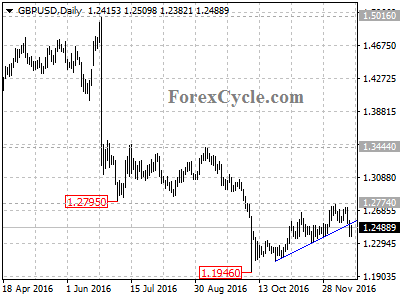
GBPUSD broke below the upward trend line on daily chart, indicate that the uptrend from 1.1946 had completed at 1.2774 already. Deeper decline to test 1.1946 support would likely be seen in a couple of weeks, a breakdown below this level will signal resumption of the long term downtrend from 1.7190 (Jul 15, 2014 high), then next target would be at 1.1000 area. Near term resistance is at 1.2600, only break above this level would trigger another rise towards 1.3500.