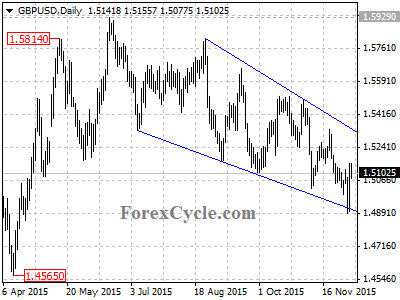
GBPUSD is in a descending wedge pattern on daily chart. Further decline would likely be seen over the next several weeks, and the target would be at 1.4700 – 1.4800 area. Near term resistance is at the upper border of wedge, and the key resistance is at 1.5400, only break above this level could bring price back to 1.6500 zone.