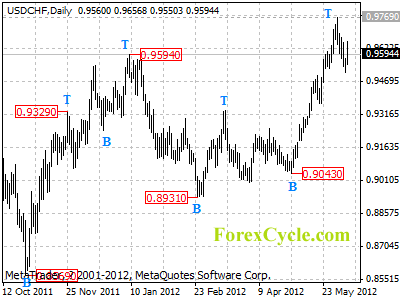
USDCHF has formed a cycle top at 0.9769 on daily chart, key support is at 0.9500, a breakdown below this level will indicate that the upward movement from 0.9043 has completed, then the following downward movement could bring price back to 0.9150 area. On the upside, as long as 0.9500 level holds, the fall from 0.9769 could be treated as consolidation of the uptrend from 0.9043, and one more rise towards 1.0000 is still possible.
For long term analysis, USDCHF has formed a cycle bottom at 0.8931 on weekly chart. Further rise towards 1.0000 would likely be seen over next several weeks.