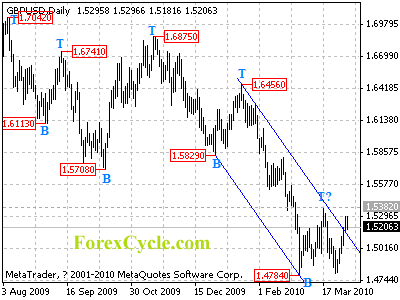
GBPUSD broke above the upper border of the falling price channel on daily chart. Sideways movement in a range between 1.4784 and 1.5382 would more likely be seen in a couple of weeks. Key resistance is now located at 1.5382, above this level will suggest that the fall from 1.6875 has completed at 1.4784 already.
For long term analysis, GBPUSD is in bearish movement from 1.7042. Move to 1.4500 area is expected in next several weeks.


