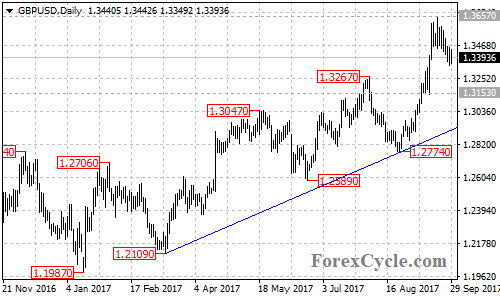
GBPUSD failed its attempt to breakout of the bearish trend line on its weekly chart and pulled back from 1.3657. However, the pair is above a bullish trend line on its daily chart, indicating that the price remains in the uptrend from 1.1946 (Oct 2016 low), and the fall from 1.3657 could be treated as consolidation of the uptrend. Near term support is at 1.3153, as long as this level holds, the uptrend could be expected to resume and another rise to test 1.3657 resistance is still possible. A break of this level could take price into 1.3950 zone. Only a clear break below the bullish trend line could signal completion of the uptrend.