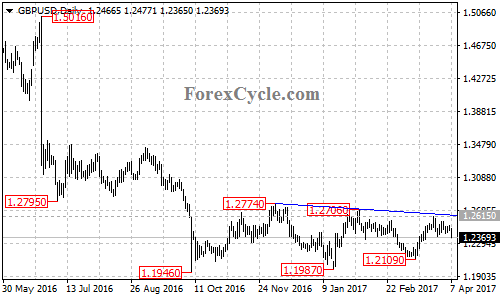
Under pressure by the downward trend line on daily chart, GBPUSD pulled back from 1.2615, indicating that lengthier sideways movement in the range between 1.1946 and 1.2774 is underway. Another fall to test 1.1946 support could be expected over the next several weeks, a breakdown below this level will signal resumption of the long term downtrend from 1.5016, then next target would be at 1.1500 area.