
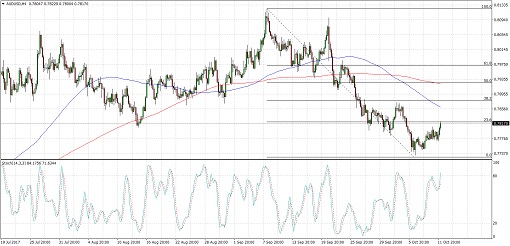
AUDUSD recently fell through support at the .7800 level then dipped to .7750 before pulling back up. Applying the Fibonacci retracement tool on the latest swing high and low on the 4-hour time frame shows that the 23.6% level lines up with the broken support that might now hold as resistance.
A larger pullback could last until the 38.2% Fib close to the 100 SMA or the 50% Fib near the 200 SMA. The short-term moving average is below the longer-term moving average to signal that the path of least resistance is to the downside, which means that the selloff is likely to resume.
Stochastic is pointing up to signal that bullish pressure is in play but the oscillator is dipping into overbought territory to suggest rally exhaustion and a return in selling pressure. In that case, AUDUSD could fall back to the swing low or lower.
The FOMC minutes turned out less hawkish than expected as a good number of Fed officials still expressed concerns about another hike. In particular, many policymakers worried that the drop in inflation might not be transitory after all. Still, the committee concluded that a gradual pace of tightening would be appropriate as long as the economy stays at its current pace.
The next event risk for the dollar is the release of the CPI and retail sales reports on Friday. This should give market watchers a better idea of how inflation is actually faring, with a downbeat result likely to dampen December hike forecasts. The upcoming PPI release should have some clues on how the CPI figures might fare.
As for the Australian dollar, the lack of top-tier reports from Australia could keep it sensitive to market sentiment. Data from China hasn’t been as impressive so expectations of weaker demand for Australia’s products could stay in play.
By Kate Curtis from Trader’s Way