
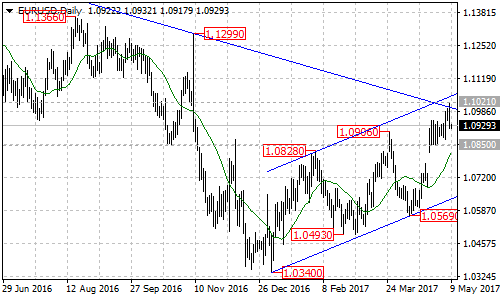
After the bullish movement that has ran for several months, EURUSD pair is now under pressure by the descending trend line on daily chart, from 1.1616 (2016 high) to 1.1299, now at 1.1000. There is also an ascending price channel on daily chart acting as a resistance at the channel top around 1.1050.
EURUSD topped at 1.1021 early Asian trading yesterday, hitting a new record for the 2017. But the pair was unable to rally and dropped down to 1.0915 level.
Has the bearish movement started?
Near term support levels is at 1.0850. A breakdown below this level will indicate that the short term uptrend from 1.0569 had completed at 1.1021 already, then the pair may find support at the bottom of the price channel.
The key support is at 1.0569, below this level will signal resumption of the long term downtrend from 1.3993 (2014 high), then the following bearish movement could bring price to 1.000 area.
However, before we make a bearish decision, we must notice that EURUSD pair remains in bullish structure. As long as 1.0850 support holds, further rally is still possible after a minor consolidation and the channel top resistance is possible to be tested. A clear break out of the channel resistance could trigger a strong run to 1.1500 area. The pair remains in the uptrend from 1.0340 even though the 1.0850 support is broken below.
Technical Levels
To the upside, 1.0850 is the initial support, the daily chart shows that the 20 moving average is around 1.0800, the channel support is now at 1.0640, and the key support is at 1.0569.
To the downside, the downward trend line resistance is now at 1.1000, 1.1050 is the channel top resistance.