Hello fellow traders. In this technical blog we’re going to take a quick look at the past Elliott Wave charts of AUDJPY . We’re going to explain the structure and see how we forecasted the path.
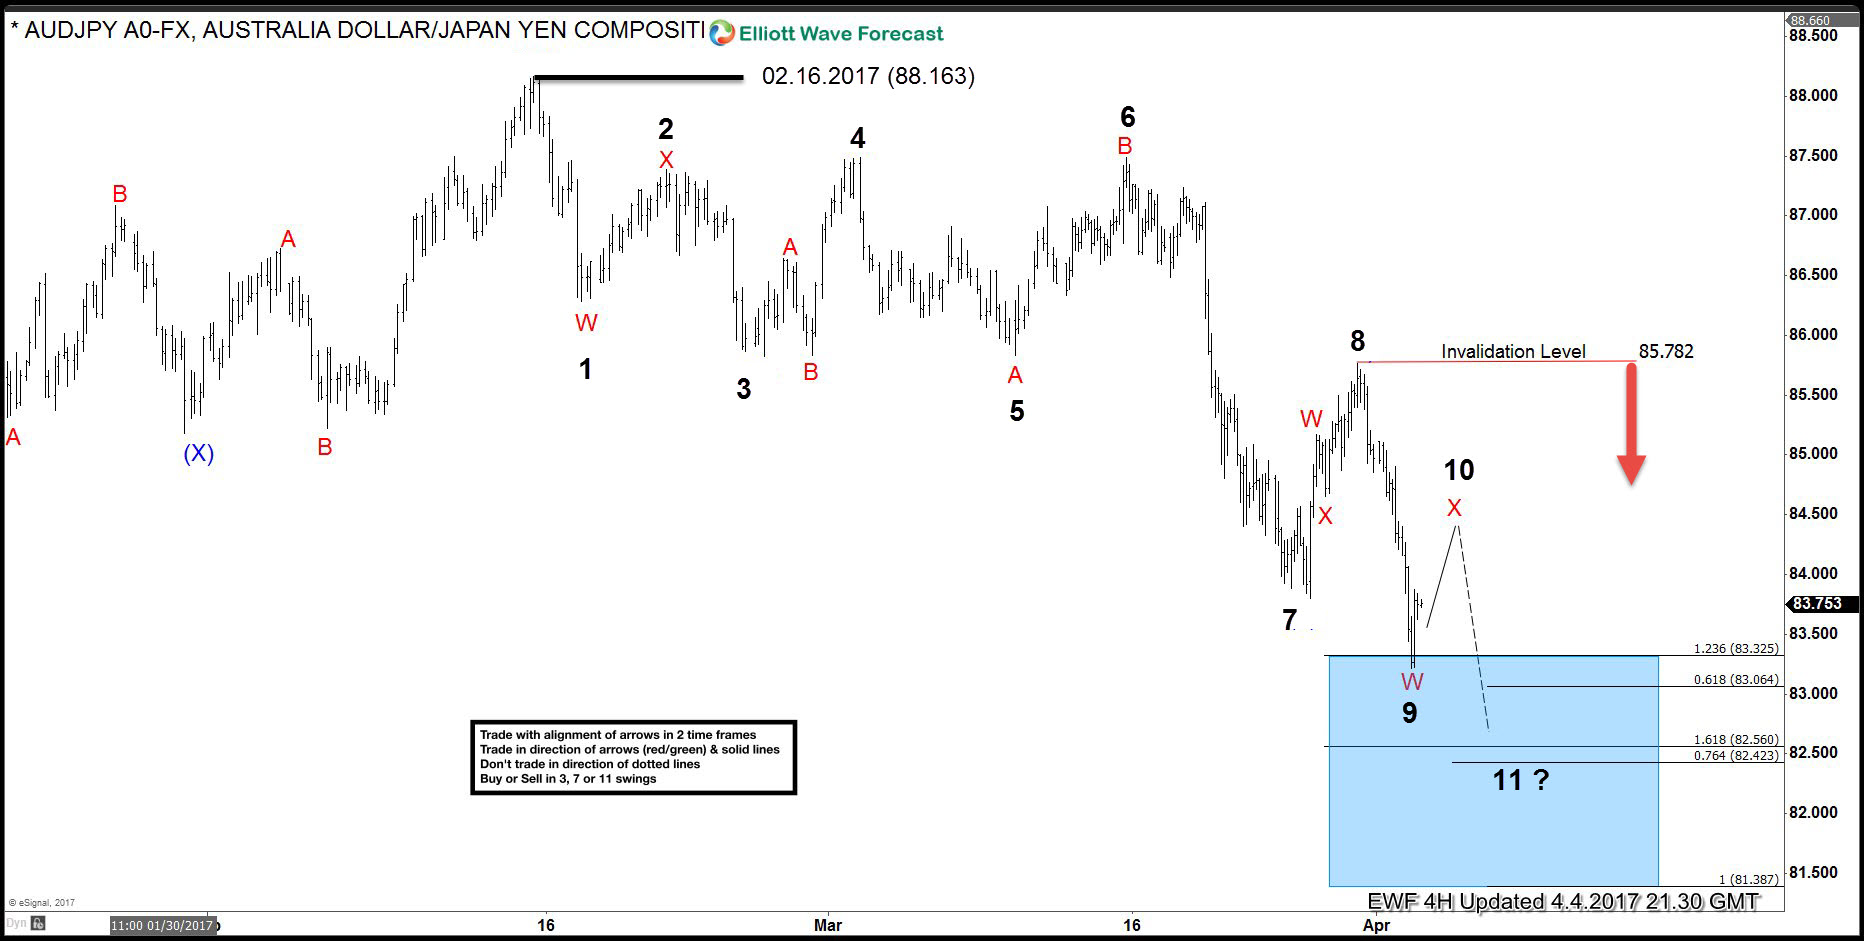
The chart below is AUDJPY 4 hour chart from 04.04.217. Our analysis suggests that cycle from the 02/16 peak (88.16) is having incomplete structure. As we’re having 9 swings down from the mentioned peak, we’re calling for more downside while pivot at 85.78 peak stays intact. We should ideally get another low in 11th swing in order to complete the structure.
Now let’s take a look at the short term structure.
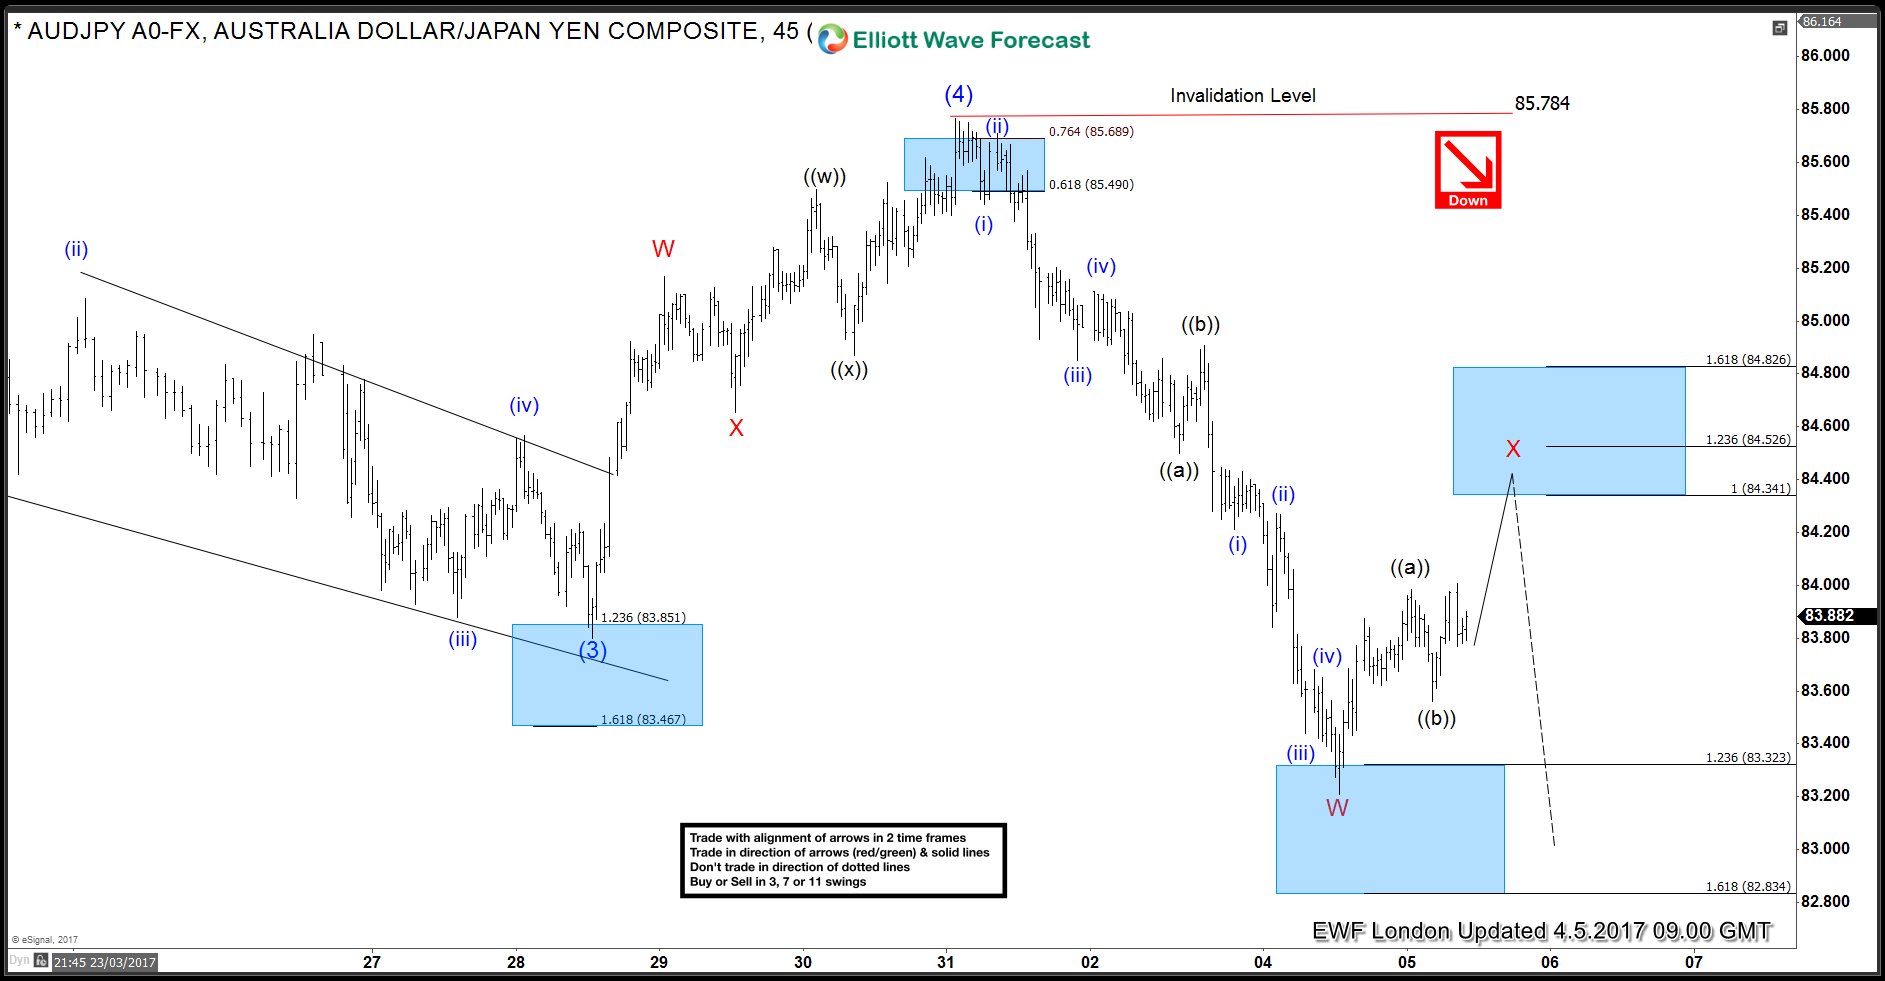
AUDJPY Elliott Wave 1 Hour Chart 04.05.2017
The pair is bearish against the 85.78 peak. Seems like it’s doing X red recovery as double ((a))((b))((c)) ZIGZAG elliott wave structure. We expect it to complete at 84.34-84.52 area, where sellers will appear. Once X red recovery completes, further decline should follow ideally toward new lows.

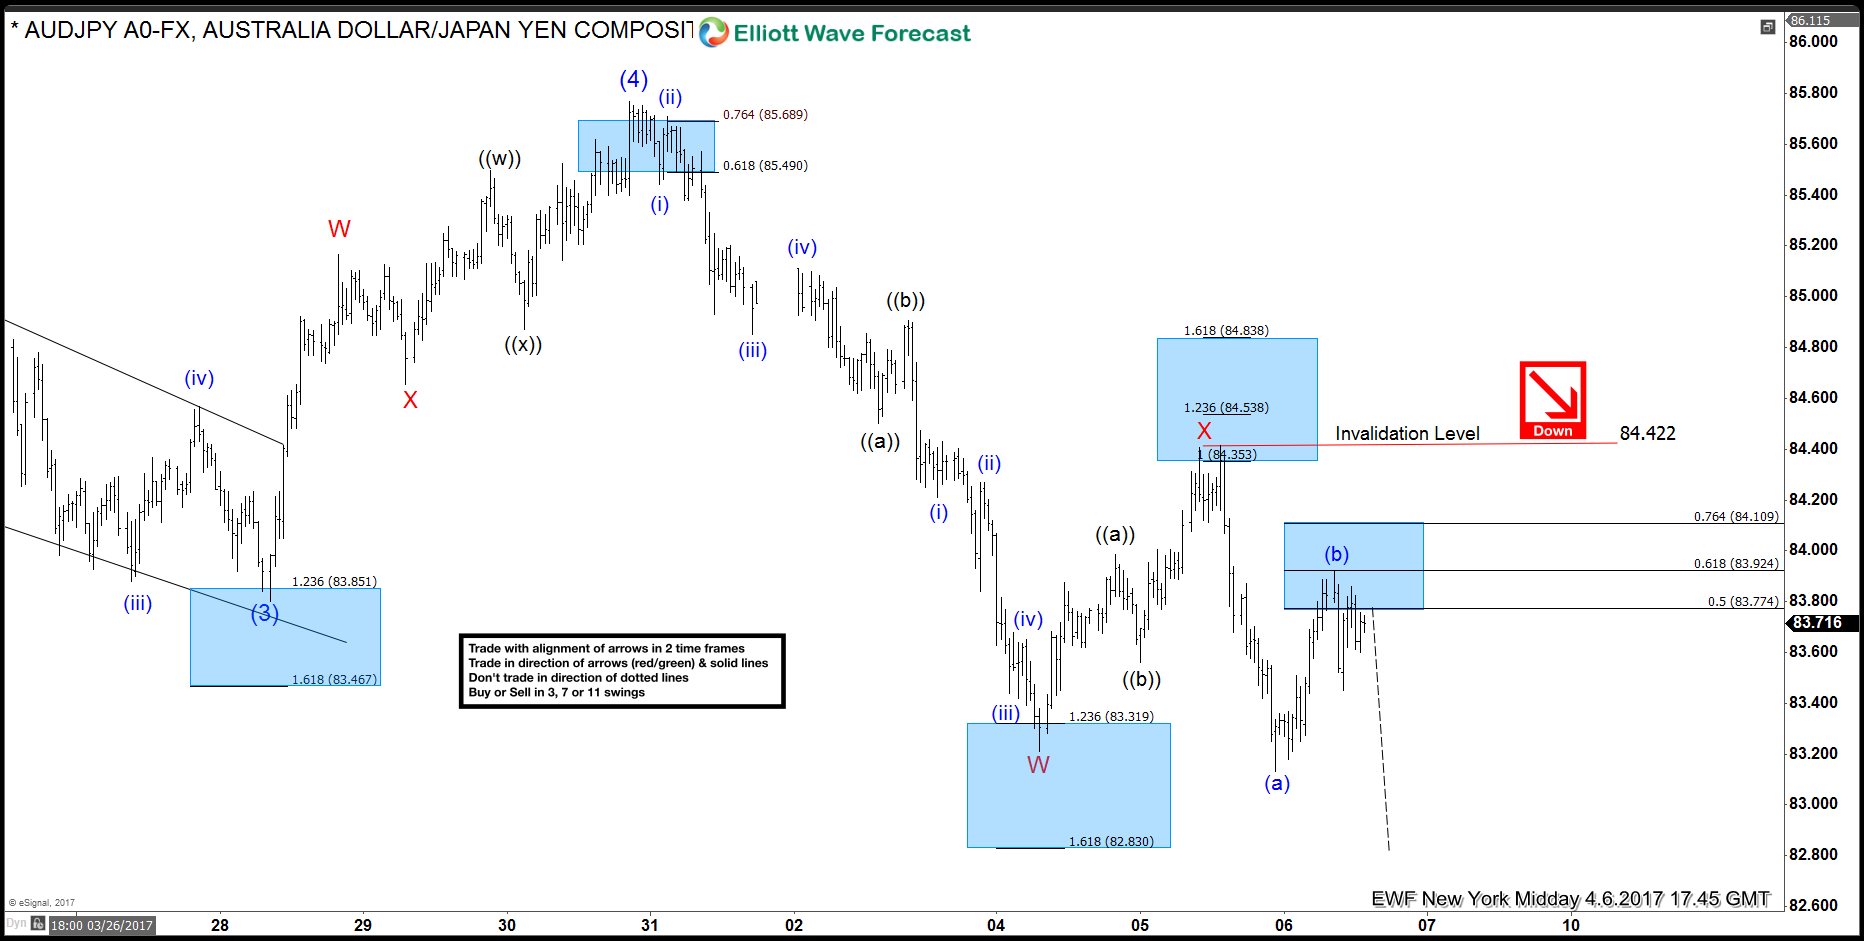
AUDJPY Elliott Wave 1 Hour Chart 04.06.2017
Eventually, the price has reached our blue box and completed proposed X red correction at the 84.42 high. The pair found sellers there and made the new low as expected. Now , it’s showing 5 swings, incomplete structure from the 85.78 peak. Consequently, the pair is still bearish against 84.42 peak,suggesting more downside. Short term bounce (b) blue is completed at 83.92 most likely.
Source : https://elliottwave-forecast.com/forex/audjpy-incomplete-sequence


