
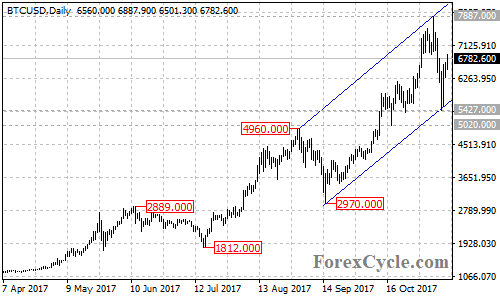
BTCUSD rebounded strongly from the bottom support trend line of the price channel on the daily chart after a sharp drop from 7887, suggesting that the bitcoin price remains in the uptrend from 1812. As long as the channel support holds, the fall from 7887 could be treated as consolidation of the uptrend and further rise could be expected after the consolidation.
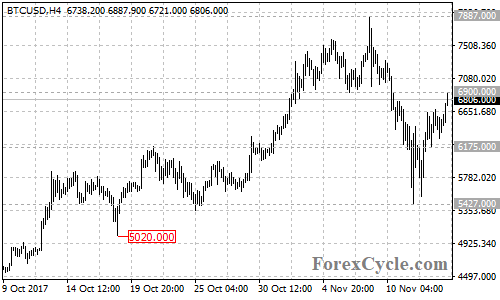
On the 4-hour chart, the bitcoin price extended its upside movement from 5427 to as high as 6888, facing a support-turned-resistance level at 6900. Above here could trigger further bullish movement towards 7887 previous high resistance. A breakout of this level will confirm that the uptrend has resumed, then next target would be at 9000. If the Bitcoin price fails to breakout of 7887 resistance, sideways movement in a trading range between 5427 and 7887 could be seen to follow.
Near term support is at 6175, a breakdown below this level could bring price back to the bottom of the channel and test 5427 support. Below here will indicate that lengthier correction for the long term uptrend is needed, then the following correction pullback could take price back to 4600 or even 3000 area.
Technical levels
Support levels: 6175, 5427, 5020, 2970.
Resistance levels: 6900, 8000, 9000.