
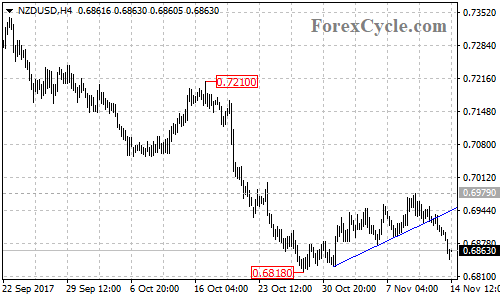
NZDUSD recently broke below a bullish support trend line on the 4-hour chart, indicating that the bounce from 0.6818 had completed at 0.6979 already.
On the downside
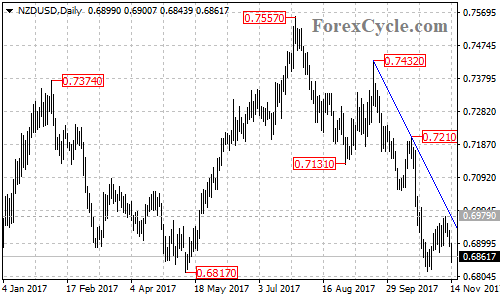
The NZDUSD pair failed to breakout of the falling trend line from 0.7432 to 0.7210 on the daily chart, suggesting that the pair remains in the downtrend from 0.7557. As long as the price is below the trend line, the downside movement could be expected to continue and further decline to test 0.6817 support could be seen in a couple of days.
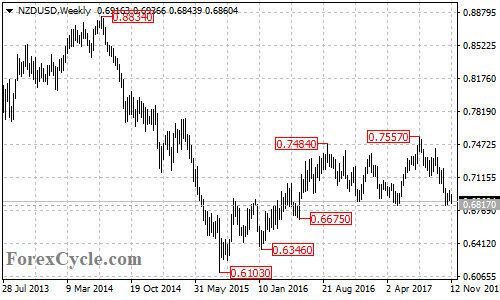
There is a double top pattern is being formed on the weekly chart with neckline at 0.6817 level. A breakdown below the neckline will confirm the reversal pattern, then next support level would be at 0.6675, followed by 0.6346. The measured move target of the double top pattern would be at around 0.6100 area.
On the upside
Near term resistance is 0.6890, a break above this level could bring price back towards the falling trend line on the daily chart and test 0.6979 resistance. Above there will indicate that lengthier consolidation for the downtrend from 0.7557 is underway, then the following upside movement could bring price back into 0.7100 zone.
Technical levels
Support levels: 0.6817, 0.6675, 0.6346, 0.6100.
Resistance levels: 0.6890, 0.6979, 0.7100.