
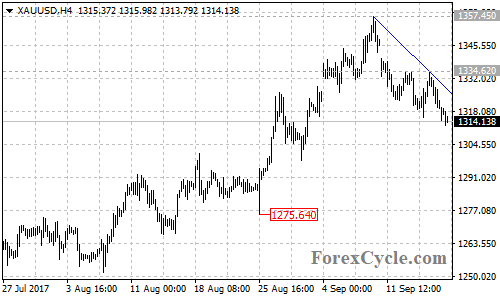
XAUUSD stays below a bearish trend line on its 4-hour chart and remains in the short term downtrend from 1357.45. As long as the price is below the trend line, the downside movement could be expected to continue.
On the downside
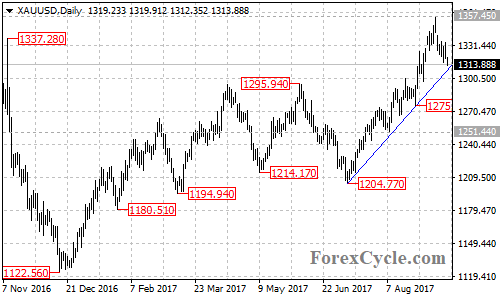
The gold price is now facing an ascending trend line from 1204.77 to 1275.64 now at 1308.70 on the daily chart. A clear break below the trend line support could suggest that the uptrend from 1204.77 had completed at 1357.45 already, then the following downside movement could bring price to next support level at 1275.64.
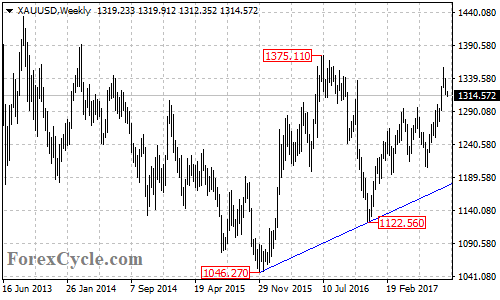
The 1275.64 level could be treated as key support for the uptrend from the December 2016 low of 1122.56. Below this level could take price towards the bullish trend line from 1046.27 to 1122.56 on the weekly chart.
On the upside
Near term resistance is at the bearish trend line on the 4-hour chart now at around 1326.90, followed by 1334.62. Breakout of these levels could signal resumption of the uptrend from 1204.77, then another rise towards the July 2016 high of 1375.11 could be seen.
Technical levels
Support levels: 1308.70 (the ascending trend line on the daily chart), 1275.64 (the key support), 1251.44 (the August 8 low).
Resistance levels: 1326.90 (the bearish trend line on the 4-hour chart), 1334.62 (near term resistance), 1357.45 (the September 8 high), 1375.11 (the July 2016 high).