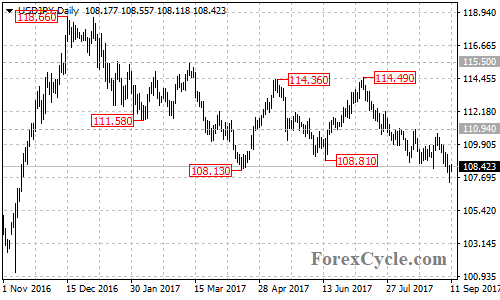
USDJPY recently broke below a major support level at 108.13, indicating that the sideways movement in a trading range between 108.13 and 115.50 is complete and the downtrend from 118.66 has resumed.
On the downside
The USDJPY pair stays below a bearish trend line with resistance at around 108.60 on the 4-hour chart. As long as the price is below the trend line, the bounce from 107.31 could be treated as consolidation of the short term downtrend from 110.67. Further decline is still possible after the consolidation, and next target would be at the 61.8% Fibonacci retracement taken from the June 2016 low of 98.97 to the December 2016 high of 118.66 at 106.50, followed by the 76.4% retracement at 103.60.
On the upside
A clear break above the bearish trend line on the 4-hour chart could suggest that the short term downtrend from 110.67 had completed at 107.31 already, then further rise to 110.00 area could be seen. However, as long as 110.94 resistance holds, the rise could be treated as consolidation of the downtrend from 114.49, and another fall could be expected after the consolidation. Only break above 110.94 resistance could take price back towards 115.50.
For long term analysis
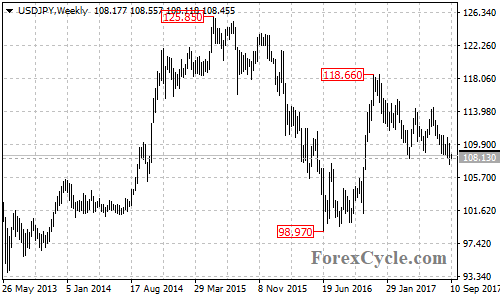
The pair remains in the uptrend from 98.97, the fall from 118.66 is likely correction of the uptrend. Another rise towards 125.85 previous high is possible after the correction, and the 103.60 level would be the final target of the correction pullback.
Technical levels
Support levels: 106.50 (the 61.8% Fibonacci retracement), 103.60 (the 76.4% Fibonacci retracement).
Resistance levels: 108.60 (the bearish trend line on the 4-hour chart), 110.94 (the August 16 high), 114.49 (the July 11 high), 115.50 (March 10 high).