
After touching 131.39 previous high resistance, EURJPY pulled back sharply from 131.70 and broke below a major support trend line on on the 4-hour chart. The pair might be forming a double top pattern with neckline at 127.56, a breakdown below this level could confirm the pattern.
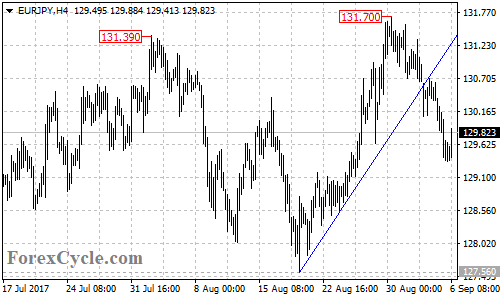
On the downside
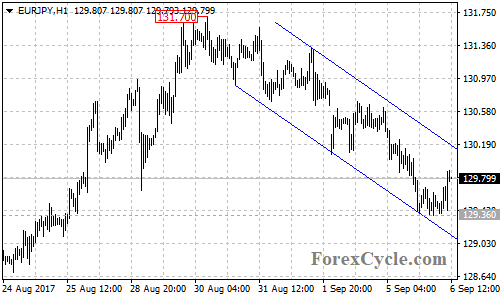
The EURJPY pair moved in a descending price channel on its 1-hour chart. As long as the price is in the channel, the bounce from 129.36 could be treated as consolidation of the downtrend from 131.70 and further decline towards 127.56 support is possible.
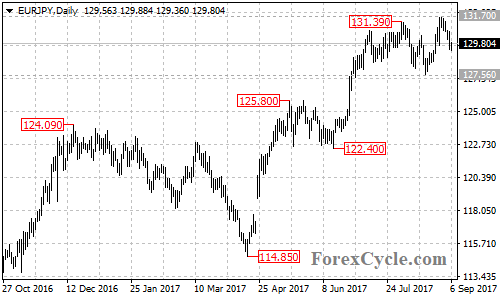
A breakdown below the neckline at 127.56 could indicate that the uptrend from 114.85 had completed at 131.70 already, then the following downside movement could take price back to next support level at 125.80, followed by 122.40.
On the upside
As long as 127.56 support holds, the price action from 131.39 would possibly be consolidation of the uptrend from 114.85, and another rise towards 133.50 is still possible after the consolidation, and this level should be the final target of the uptrend.
Near term resistance is at the top trend line of the price channel on the 1-hour chart now at around 130.20. A clear break above the channel resistance could bring price back towards 131.70, above this level could signal resumption of the uptrend from 114.85.
Technical levels
Support levels: 127.56 (key support), 125.80 (the May 16 high), 122.40 (the June 15 low), 121.20 (the 61.8% Fibonacci support).
Resistance levels: 130.20 (the top trend line of the price channel on the 1-hour chart), 131.70 (the August 30 high), 133.50 (the final target of the uptrend).