
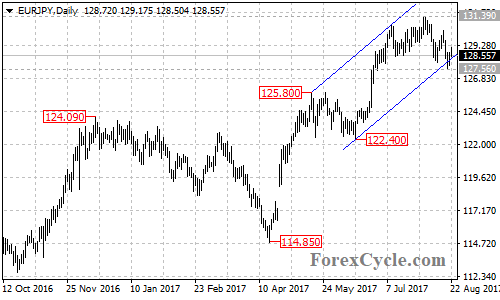
EURJPY rebounded from 127.56 after touching the bottom support trend line of the price channel on the daily chart, suggesting that the pair remains in the uptrend from 114.85. As long as the price is in the channel, the fall from 131.39 could be treated as consolidation of the uptrend.
On the upside
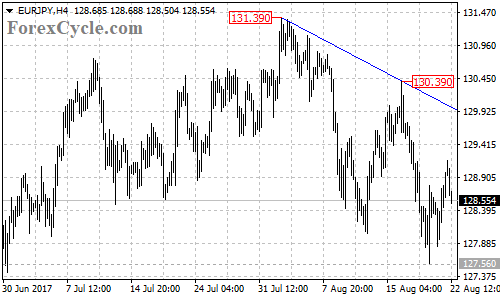
Near term resistance is located at the descending trend line from 131.39 to 130.39 on the 4-hour chart, now at around 130.00. A clear break above the trend line resistance could take price to next resistance level at 131.39, above this level will confirm that the bullish movement from 114.85 has resumed, then next target would be at 133.50 area. The 133.50 level should be the final target of the uptrend.
On the downside
As long as the EURJPY pair is below the bearish trend line on the 4-hour chart, the downside movement could be expected to continue and further decline to test 127.56 support is possible. The 127.56 level is acting as the key support of the bullish movement from 114.85, below this level could signal completion of the uptrend, then the pair would find next support level at 125.80, followed by 122.40. The final target for the downside movement would be at the 61.8% Fibonacci level, taken from 114.85 to 131.39, at around 121.20.
Technical levels
Support levels: 127.56 (key support), 125.80 (the May 16 high), 122.40 (the June 15 low), 121.20 (the 61.8% Fibonacci support).
Resistance levels: 130.00 (the descending trend line on the 4-hour chart), 131.39 (the August 2 high), 133.50 (the final target of the uptrend).