
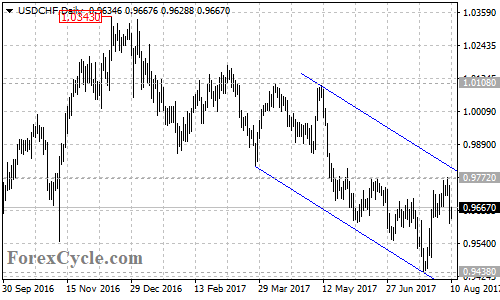
USDCHF pulled back from 0.9772 to as low as 0.9611 after approaching the top resistance trend line of the price channel on its daily chart, indicating that the pair remains in the downtrend from the December 2012 high of 1.0343.
On the 4-hour chart, the USDCHF pair broke below an important support level at 0.9630, suggesting that the short term upside movement from 0.9438 had completed at 0.9772 already.
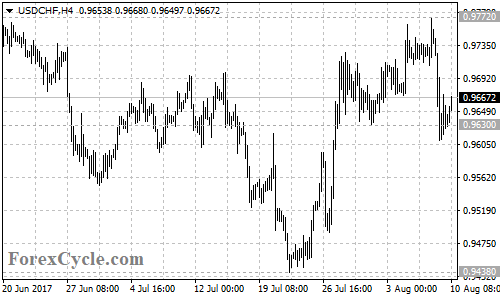
On the downside, the pair is now in short term downtrend from 0.9772. The price could be expected to test the fist support level of the 76.4% Fibonacci retracement, taken from 0.9438 to 0.9772 at around 0.9520. A breakdown below this level could bring price to the second support level at 0.9438 previous low, below this level will confirm that the downtrend from 1.0343 has resumed, then the following bearish movement could bring price to 0.9200 or even 0.9000.
On the other side, as long as 0.9520 Fibonacci support holds, the pullback from 0.9772 would possibly be correction of the uptrend from 0.9438, another rise to retest the resistance of the price channel on daily chart now at around 0.9810 is still possible. A clear break above the channel resistance will suggest that the whole downside movement from 1.0343 had completed at 0.9438 already, then next target would be at 1.0108 followed by 1.0343.
Technical levels
Support levels: 0.9520 (the 76.4% Fibonacci retracement), 0.9438 (the July 21 low), 0.9200, 0.9000.
Resistance levels: 0.9772 (the August 8 high), 0.9810 (the top trend line of the price channel on the daily chart), 1.0108 (the April 10 high), 1.0343 (the December 2016 high).