
EURJPY dropped sharply to as low as 128.70 after breaking below a major support trend line at 130.35 on its 4-hour chart. Further decline is still possible in a couple of days.
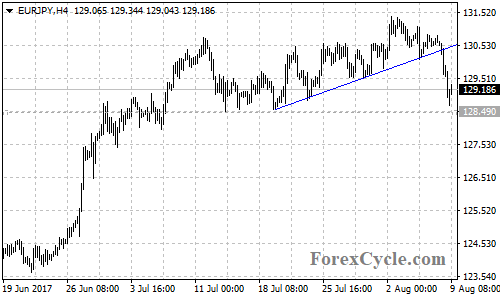
On the downside, the pair could be expected to test 128.49 support in the coming days, a break through this level could take price to the bottom support trend line of the price channel on the daily chart, now at around 127.20.
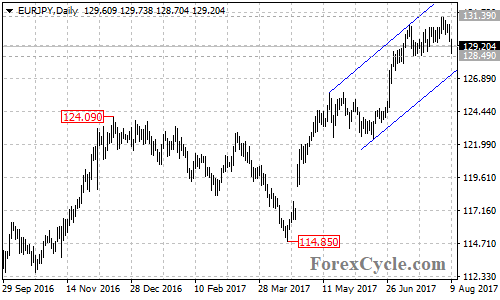
The bottom trend line of the channel could be treated as key support of the bullish movement from the April 17 low of 114.85. A clear break below the channel support will indicate that the bullish movement had completed at 131.39 already, then the following bearish movement could bring price back towards the 61.8% Fibonacci support, taken from 114.85 to 131.39, at around 121.20.
On the upside, as long as the EURJPY pair is in the channel, the fall from 131.39 could be treated as consolidation of the uptrend from 114.85, and another rise towards 133.50 is possible after the consolidation. Near term resistance is at 130.60, a break above this level could signal resumption of the uptrend. The 133.50 level should be the final target of the uptrend.
Technical levels
Support levels: 128.49 (the near term support), 127.20 (the bottom of the price channel on the daily chart), 123.10 (the 50% Fibonacci support),121.20 (the 61.8% Fibonacci support).
Resistance levels: 130.60 (the near term resistance), 131.39 (August 2 high), 133.50 (the final target).