
XAUUSD recently broke below the bullish support trend line at 1264 on its 4-hour chart, indicating that a short term top had been formed and correction pullback could be seen in the coming days.
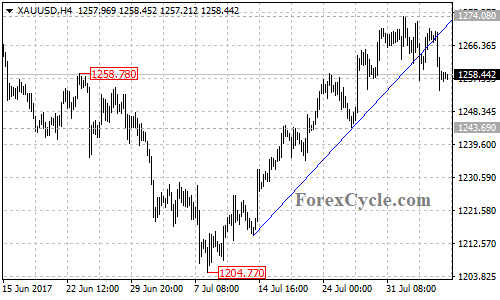
On the downside
The gold price could be expected to test the first support level at 1243.69, a breakdown below this level could take price to the second support level at the 61.8% Fibonacci retracement, taken from 1204.77 to 1274.08, at around 1230.
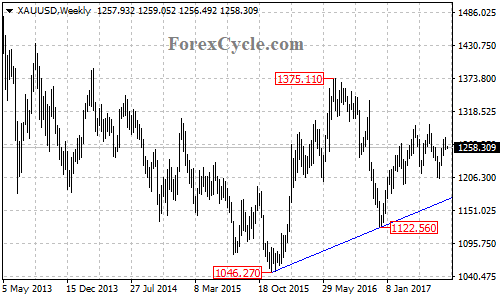
The key support is at 1204.77, a breakdown below this level will confirm that the downtrend from 1295.94 has resumed, then the gold price will find support at the trend line on its weekly chart, now at around 1170.
On the upside
As long as 1230 support holds, the fall from 1274.08 would possibly be correction of the uptrend from 1204.77, another rise to retest 1300 resistance is still possible. Near term resistance is at 1274.08, a break of this level will indicate that the uptrend from 1204.77 has resumed, then another bullish movement could be seen to follow.
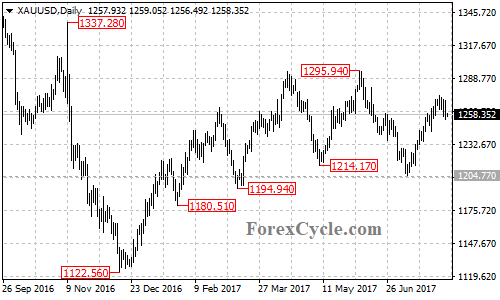
The 1300 resistance is the important psychological level, a breakout of this level will signal resumption of the long term uptrend from the December 2016 low of 1122.56, then the following bullish movement could bring price to next resistance level at 1337.28.
Technical levels
Support levels: 1243.69 (the near term support), 1230 (the 61.8% Fibonacci retracement), 1204.77 (the July 10 low), 1170 (the support trend line on the weekly chart).
Resistance levels: 1274.08 (the near term resistance), 1295.94 (the June 6 high), 1300 (the important psychological level), 1337.28 (the November 2016 high), 1375.11 (the July 2016 high).