
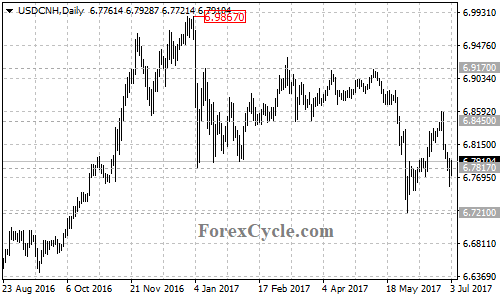
After breaking above the support-turned-resistance at 6.8450 on the daily chart, the USDCNH pair failed to extend its bullish movement from 6.7210 and pulled back from 6.8583, indicating that correction for the uptrend is underway.
On the downside, the pair recently broke below the major ascending trend line from 6.7210 to 6.7707 at 6.8140 on its 4-hour chart and is now in short term downtrend from 6.8583. Near term resistance is at 6.8042. As long as the price is below this level, the downside movement could be expected to continue and next target would be at around 6.7400.
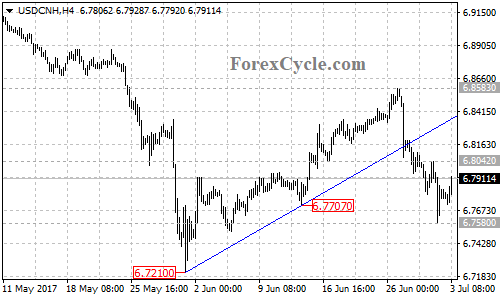
On the other side, a break above 6.8042 resistance will suggest that the correction pullback had completed at 6.7580 already, then further rise to test 6.8583 resistance could be seen.
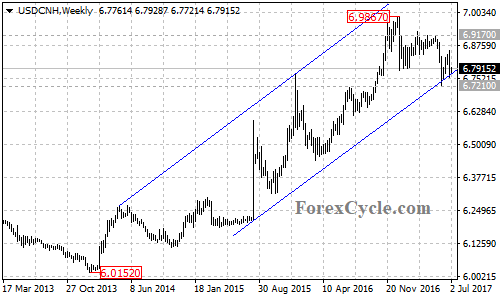
For long term analysis, the USDCNH pair rebounded away from the bottom support trend line of the price channel on its weekly chart. Further rise would more likely be seen and a clear break of 6.9170 key resistance will confirm that the consolidation pullback from the January 3 high of 6.9867 for the long term uptrend is complete, then the following upside movement could take price to the important psychological level of 7.0000.
Technical levels
Support levels: 6.7580 (the June 30 low), 6.7210 (the June 1 low).
Resistance levels: 6.8042 (near term resistance), 6.8450 (the March 15 low), 6.8583 (The June 26 high), 6.9170 (key resistance), 6.9867 (the January 3 high), 7.0000 (the important psychological level).