
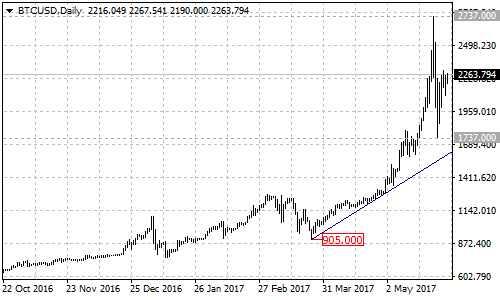
After hitting a new record of 2737, BTCUSD dropped sharply to as low as 1737. However, the fall would possibly be consolidation of the uptrend from 905. There is an ascending trend line from the March 25 low of 905 with support at around 1600 on its daily chart. As long as the pair is above the trend line, the price action from 2737 could be treated as consolidation of the uptrend and another rise could be expected after the consolidation.
On the upside
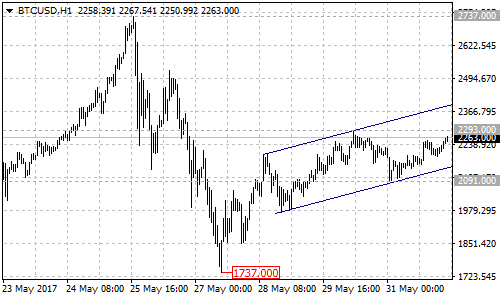
Let’s look into its 1-hour chart. The Bitcoin is running in an ascending price channel with support at around 2145, indicating that it is in short term uptrend from 1737. Further rally could be expected in a couple of days and next target would be at the 61.8% Fibonacci retracement taken from 2737 to 1737 at around 2355, a break through this level could take price into 2500 zone.
On the downside
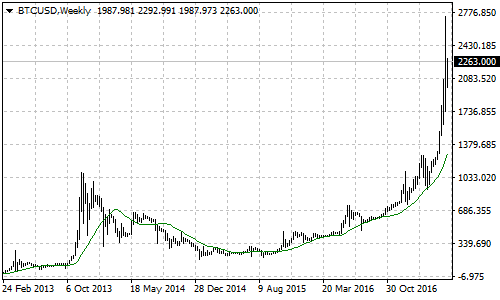
Near term support is at the bottom trend line of the channel on the 1-hour chart, and the key support for the short term uptrend is at 2091, only a breakdown below this level will indicate that the upward movement had completed at 2293 already, this could trigger another fall to test the support of the rising trend line on daily chart. If the trend line support gives way, the Bitcoin will find support at the 20 moving average on its week chart, now at around 1290.
Technical levels
Support levels: 2145 (the ascending price channel on 1-hour chart), 2091 (the key support for the short term uptrend), 1737 (May 27 low), 1600 (the bullish trend line on daily chart), 1290 (20-week moving average).
Resistance levels: 2293 (May 30 high), 2355 (61.8% Fibonacci retracement), 2500.