
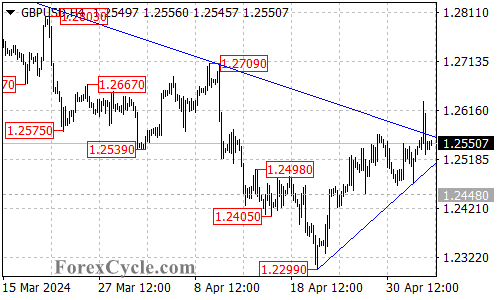
The GBPUSD currency pair has broken out above the falling trendline resistance visible on the 4-hour chart. This technical breakout suggests that the recent downside move from the 1.2893 high has likely completed at the 1.2299 low.
Uptrend Taking Shape After Breakout
Following the bullish breakout above trendline resistance, the GBPUSD has established a new rising trendline of support on the 4-hour chart. As long as this trendline support holds on a closing basis, the path of least resistance for the pair appears to be further upside.The next key upside target to watch is the 1.2700 area. If buyers can push the GBPUSD above 1.2700, it would open the door for a potential rally toward the 1.2800 handle.
Trendline Support Key for Bullish Outlook
While the technical outlook has shifted to a more bullish bias in the near-term, traders will want to keep a close eye on the rising trendline support on the 4-hour chart. A breakdown below this trendline would likely signal that the recent upside move has stalled.In this scenario, the first level of support to watch would be the 1.2448 area. Only a break below 1.2448 would likely confirm a resumption of the broader downtrend, with the next key downside target in the 1.2299 zone.
Key Levels to Watch
For now, the key levels to watch in the GBPUSD are the rising 4-hour trendline support, the 1.2700 upside target, and the 1.2448 and 1.2299 support areas.
As long as the pair remains above trendline support, the near-term technical bias will remain tilted to the upside, with the 1.2700 and 1.2800 levels being the next objectives.
However, a breakdown below trendline support and the 1.2448 level would likely signal a resumption of the broader downtrend, with the 1.2299 low being back in focus.
The GBPUSD has shifted to a more bullish near-term technical outlook after the recent breakout above trendline resistance. While further gains appear likely, traders will want to keep a close eye on the rising trendline support for potential signs that the upside momentum could be stalling.