GBPUSD has displayed a bullish sign, potentially breaking free from a downtrend. This analysis examines the technical situation and explores potential scenarios for the currency pair.
GBPUSD Breaches Downtrend Line:
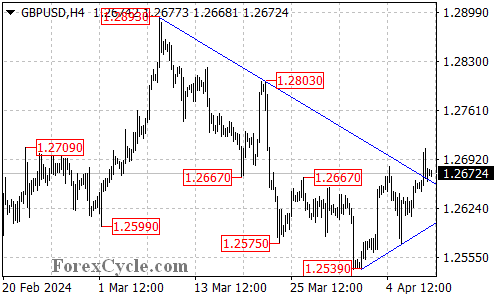
- Falling Trend Line Overcome: GBPUSD has decisively broken above the falling trend line on its 4-hour chart. This trend line has been a significant resistance level throughout the recent downtrend that began at 1.2893.
Uptrend Resumption or False Breakout?
- Downturn Potentially Reversed: The breakout above the falling trend line suggests a possible completion of the downside movement from 1.2893. This could signal a reversal of the downtrend and the start of a new uptrend.
- Upside Potential: If the uptrend resumes, a further rally could be expected in the coming days. The next potential target zones to watch could be around 1.2800 and even higher at the previous high of 1.2893.
New Support Level Established:
- Rising Trend Line as Support: The key support level has now shifted to the rising trend line on the 4-hour chart. This trend line will likely act as a new support in the potential uptrend scenario.
- Downturn Signal on Break Below: A breakdown below the rising trend line support would be a significant bearish development. This move could indicate that the breakout above the falling trend line was a false breakout (bull trap) and that the downtrend is still in play.
- Downside Risk: In a renewed downtrend scenario, another fall towards the 1.2400 target zone could be back on the table.
Overall Sentiment:
The technical outlook for GBPUSD has shifted to bullish in the short term. The breakout above the falling trend line is a promising sign for a trend reversal. However, close monitoring of price action around the new support level (rising trend line) is crucial. A break below this level could indicate a continuation of the downtrend.