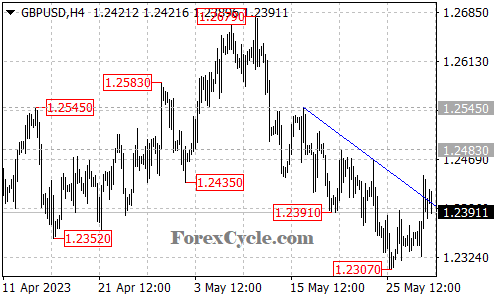
The GBPUSD currency pair has recently broken above a falling trend line on the 4-hour chart, signaling a potential shift in the market dynamics. This breakout suggests a period of consolidation for the ongoing downtrend from 1.2679.
The break above the trend line opens the door for further upside movement, with a possible test of the 1.2483 resistance level. If the price manages to break above this resistance, it would indicate that the previous downside move from 1.2679 has potentially completed at the recent low of 1.2307. In such a scenario, the pair may continue to rise towards the next resistance level at 1.2700.
However, it is important to note that as long as the 1.2483 resistance holds, the bounce from 1.2307 can still be considered a consolidation phase within the broader downtrend. A breakdown below 1.2307 could trigger another round of selling pressure, potentially leading to a decline towards the 1.2200 support area.
Traders should closely monitor the price action around the key levels of 1.2483 and 1.2307 to gauge the potential direction of GBPUSD. Breakouts or failures to break these levels could provide valuable insights into the strength of the current trend and potential reversal patterns.
In summary, GBPUSD has broken above a falling trend line on the 4-hour chart, indicating a potential period of consolidation for the ongoing downtrend. Further upside movement towards the 1.2483 resistance level is possible. However, as long as 1.2483 holds, the bounce from 1.2307 could be considered a consolidation phase. A breakdown below 1.2307 would suggest a continuation of the downtrend, potentially targeting the 1.2200 support area. Traders should closely monitor price action and key levels to make informed trading decisions based on the evolving market conditions.