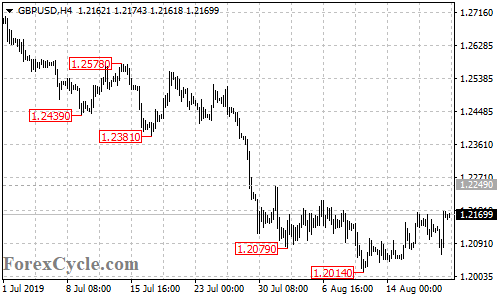
GBPUSD moved sideways in a trading range between 1.2014 and 1.2249. As long as 1.2249 resistance holds, the sideways movement could be treated as consolidation for the downtrend from 1.2578, one more fall towards 1.1950 is still possible after the consolidation. Only break above 1.2249 resistance could signal completion of the downtrend.