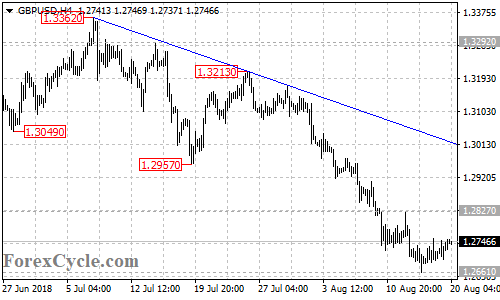
GBPUSD moved sideways in a trading range between 1.2661 and 1.2827. As long as 1.2827 resistance holds, the sideways movement could be treated as consolidation of the downtrend and a breakdown below 1.2661 could trigger another fall towards 1.2600 area. On the upside, a breakout of 1.2827 resistance would indicate that the downside movement had completed at 1.2661 already, then the pair would find resistance at the falling trend line on the 4-hour chart.